 1 / 99ACTIVE
$110,000,000
9 beds | 11 baths | 10,791 sqft | 0.75 acres
1420 W 23rd St, Miami Beach, FL 33140
LISTED BY Coldwell Banker Realty↗
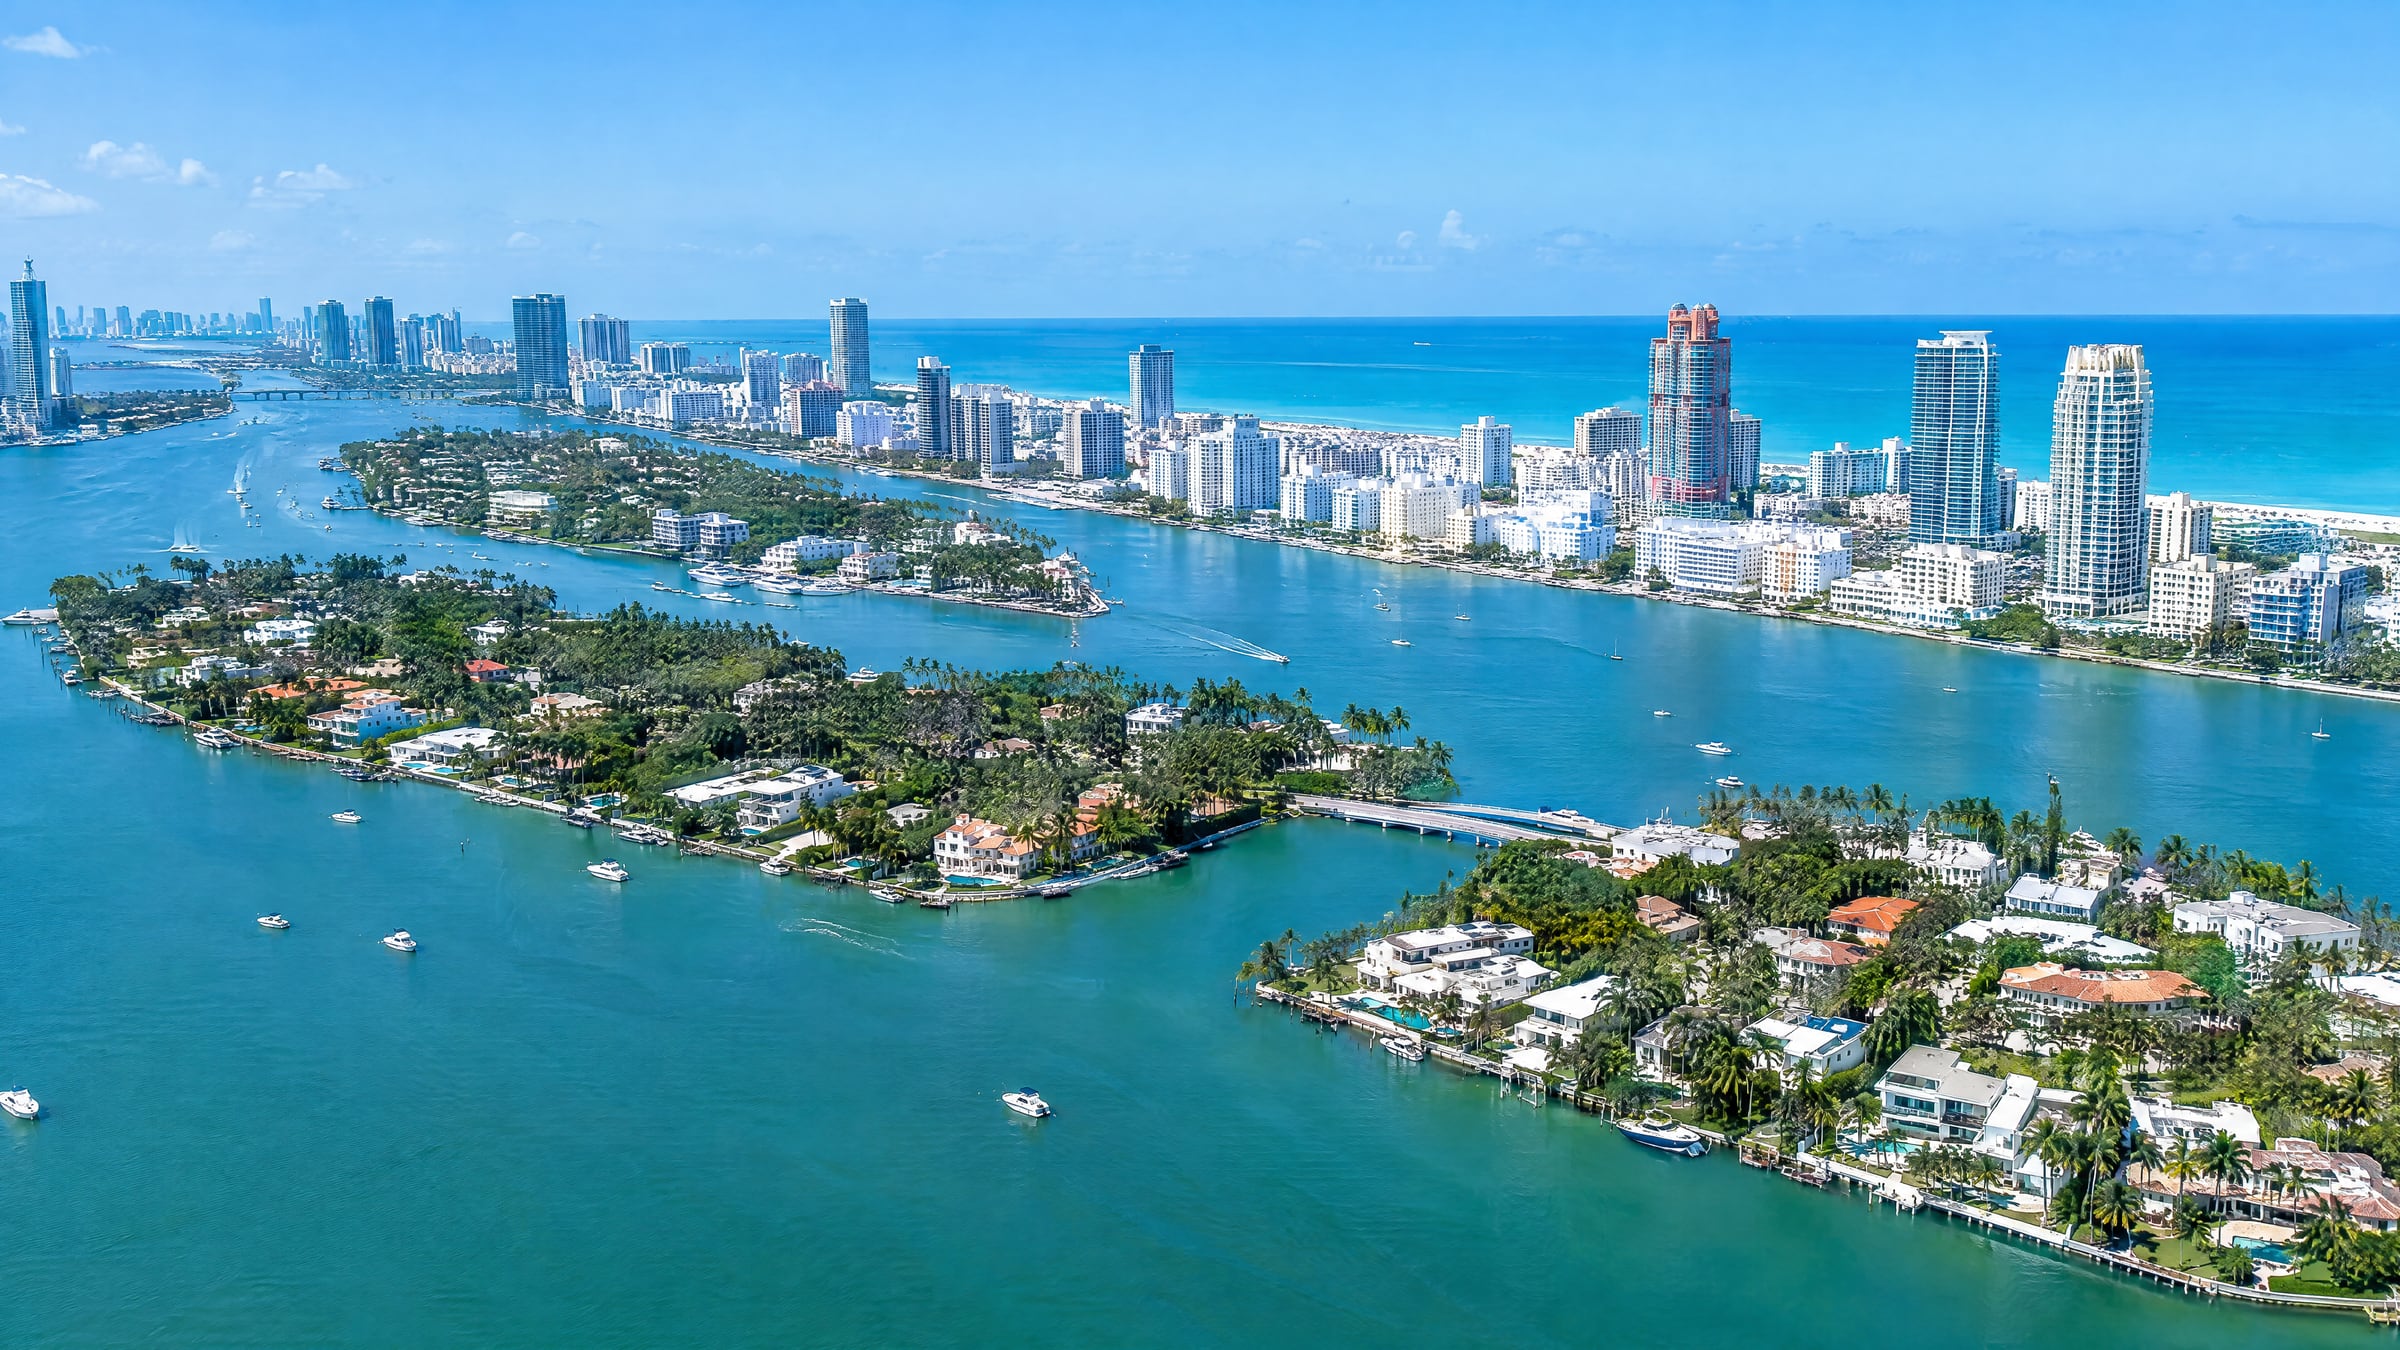
Miami Beach is a city of its own, incorporated in 1915 on a barrier island between Biscayne Bay and the Atlantic Ocean. This page reads it from the County's parcel record, the City's own pages and the MLS.
On the market from $2,000,000, the highest price first.
LIVE · MLS · AS OF NOV 1, 20269 OF 159 FROM $2M SHOWN
1 / 99ACTIVE 1 / 8ACTIVE
 1 / 66ACTIVE
 1 / 50ACTIVE
 1 / 13ACTIVE
 1 / 14ACTIVE
 1 / 19ACTIVE
 1 / 89ACTIVE
 1 / 72ACTIVE
Miami Beach is a city of its own in Miami-Dade County, not the City of Miami, and a market of condominiums first.
It was incorporated on March 26, 1915, by the City of Miami Beach and Miami-Dade County's list of municipalities, read October 29, 2026. The City describes it as a barrier island community between Biscayne Bay and the Atlantic Ocean, with over 7 miles of beaches, on its own pages read October 29, 2026. South Beach is one part of it, not another name for it.
The Miami-Dade Property Appraiser's record for assessment year 2026 counts 43,034 residential condominium units. They stand in 927 condominiums, by the same 2026 record. The same 2026 record counts 4,834 single-family homes. One house in five stands on one of 13 islands in Biscayne Bay, among them Star Island, the Sunset Islands and four of the six Venetian Islands.
This site reads the city in three areas, by postal code: South Beach, Mid-Beach and North Beach. The City prohibits short-term rentals in all single-family homes and in many multifamily buildings, by zoning district. The City lists 14 local historic districts. Prices and inventory on this page are read from the MLS.
The market, in one sentence. In the twelve months to September 30, 2026, single-family homes in Miami Beach closed at a median of $4,200,000, from 253 closed sales, and condominiums at a median of $558 per square foot, from 1,615 closed sales (closed sales the MIAMI REALTORS® MLS reported, read October 12, 2026). They are the market's sales, not Julian Acosta's own.
Miami Beach is two markets in one city: 43,034 residential condominium units in 927 condominiums, and 4,834 single-family homes, by the Miami-Dade Property Appraiser's record for assessment year 2026.
The buildings are older than the skyline suggests: 26,050 of the units are in buildings the County dates before 1980, and 7,518 of those before 1960; 1,565 are in buildings dated 2015 or later.
The house is older still. The median single-family home was built in 1948, on a median lot of 8,929 SF; 3,825 predate 1960, and 469 have been built since 2015.
Record figures are the Miami-Dade Property Appraiser's, assessment year 2026, read October 4, 2026, for the parcels and units that carry the City of Miami Beach's folio code, without three condominiums on Fisher Island. Live figures are read from the MIAMI REALTORS® MLS for this site's Miami Beach zone; its closed sales are the MLS's for the twelve months to September 30, 2026, read October 12, 2026. A dash is a value the feed has not supplied, never a zero.
This glance tells you where the Miami Beach market stands today: how many homes are for sale, read live from the MIAMI REALTORS® MLS, beside what its houses and condominiums sold for in the twelve months to September 30, 2026, a median of $4,200,000 for a house and $558 per square foot for a condominium. It does not value a single home.
Real local data by micromarket: Miami Beach's closed sales in the market report's four areas, South Beach, Mid-Beach, North Beach and the islands, each by type of home and by the water, over the twelve months to September 30, 2026.
Choose a micromarket on the map or here to go to its figures, below.
Condominiums by area: Miami Beach condominium medians ran from $342,250 in North Beach to $635,000 in Mid-Beach, in 12 months.
An area's median is its typical price: half its homes sold for more and half for less. In Miami Beach, the area moves a condominium's price more than the year does.
Waterfront and dry: A Miami Beach house on the water sold for a median of $10,900,000 over the 12 months to September 2026; off the water, $2,825,000.
In Miami Beach, the water divides house prices: most of its waterfront houses stand on the islands and the bay's shore.
Median sale price · single-family
$3,400,000
A year earlier: $2,825,000 · ▲ 20.4%
If you own a house in Mid-Beach, this is your yardstick: half of the 105 houses sold there in the 12 months to September 30, 2026 closed above $3,400,000 and half below, against $4,200,000 across Miami Beach (MIAMI REALTORS® MLS).
12 months · 105 sales · MIAMI REALTORS® MLS
Closed sales
105
A year earlier: 104
105 houses sold in Mid-Beach in the 12 months to September 30, 2026, about 9 a month, against 104 the 12 months before (MIAMI REALTORS® MLS).
12 months · 105 sales · MIAMI REALTORS® MLS
Median price per sq ft · single-family
$1,135
A year earlier: $1,016 · ▲ 11.7%
To compare homes of different sizes, look at the price per square foot: a house in Mid-Beach sold for a median $1,135 in the 12 months to September 30, 2026, so 2,000 Sq.Ft at that rate comes to about $2,270,000 (MIAMI REALTORS® MLS).
12 months · 105 sales · MIAMI REALTORS® MLS
Median days on market · single-family
99 days
A year earlier: 95.5 days
If you sell a house in Mid-Beach, plan for about 14 weeks: the typical one took 99 days to sell in the 12 months to September 30, 2026 (MIAMI REALTORS® MLS).
12 months · 105 sales · MIAMI REALTORS® MLS
Median sale price · condominiums
$635,000
A year earlier: $567,500 · ▲ 11.9%
If you own a condominium in Mid-Beach, this is your yardstick: half of the 347 condominiums sold there in the 12 months to September 30, 2026 closed above $635,000 and half below, against $499,000 across Miami Beach (MIAMI REALTORS® MLS).
12 months · 347 sales · MIAMI REALTORS® MLS
Closed sales
347
A year earlier: 330
347 condominiums sold in Mid-Beach in the 12 months to September 30, 2026, about 29 a month, against 330 the 12 months before (MIAMI REALTORS® MLS).
12 months · 347 sales · MIAMI REALTORS® MLS
Median price per sq ft · condominiums
$553
A year earlier: $548 · ▲ 0.9%
To compare homes of different sizes, look at the price per square foot: a condominium in Mid-Beach sold for a median $553 in the 12 months to September 30, 2026, so 1,000 Sq.Ft at that rate comes to about $550,000 (MIAMI REALTORS® MLS).
12 months · 347 sales · MIAMI REALTORS® MLS
Median days on market · condominiums
78 days
A year earlier: 100 days
If you sell a condominium in Mid-Beach, plan for about 11 weeks: the typical one took 78 days to sell in the 12 months to September 30, 2026 (MIAMI REALTORS® MLS).
12 months · 347 sales · MIAMI REALTORS® MLS
Townhouses · none sold
On the water, 16 houses sold; off it, 89.
In a building on the water, 312 condominiums sold at a median of $670,000; off it, 35 at $335,000.
Full report for Mid-Beach →Median sale price · single-family
$11,150,000
A year earlier: $9,891,666 · ▲ 12.7%
If you own a house in the islands, this is your yardstick: half of the 74 houses sold there in the 12 months to September 30, 2026 closed above $11,150,000 and half below, against $4,200,000 across Miami Beach (MIAMI REALTORS® MLS).
12 months · 74 sales · MIAMI REALTORS® MLS
Closed sales
74
A year earlier: 54
74 houses sold in the islands in the 12 months to September 30, 2026, about 6 a month, against 54 the 12 months before (MIAMI REALTORS® MLS).
12 months · 74 sales · MIAMI REALTORS® MLS
Median price per sq ft · single-family
$2,481
A year earlier: $2,425 · ▲ 2.3%
To compare homes of different sizes, look at the price per square foot: a house in the islands sold for a median $2,481 in the 12 months to September 30, 2026, so 2,000 Sq.Ft at that rate comes to about $4,960,000 (MIAMI REALTORS® MLS).
12 months · 74 sales · MIAMI REALTORS® MLS
Median days on market · single-family
96.5 days
A year earlier: 76.5 days
If you sell a house in the islands, plan for about 14 weeks: the typical one took 96.5 days to sell in the 12 months to September 30, 2026 (MIAMI REALTORS® MLS).
12 months · 74 sales · MIAMI REALTORS® MLS
Median sale price · condominiums
$1,145,000
A year earlier: $973,750 · ▲ 17.6%
If you own a condominium in the islands, this is your yardstick: half of the 68 condominiums sold there in the 12 months to September 30, 2026 closed above $1,145,000 and half below, against $499,000 across Miami Beach (MIAMI REALTORS® MLS).
12 months · 68 sales · MIAMI REALTORS® MLS
Closed sales
68
A year earlier: 54
68 condominiums sold in the islands in the 12 months to September 30, 2026, about 6 a month, against 54 the 12 months before (MIAMI REALTORS® MLS).
12 months · 68 sales · MIAMI REALTORS® MLS
Median price per sq ft · condominiums
$810
A year earlier: $755 · ▲ 7.3%
To compare homes of different sizes, look at the price per square foot: a condominium in the islands sold for a median $810 in the 12 months to September 30, 2026, so 1,000 Sq.Ft at that rate comes to about $810,000 (MIAMI REALTORS® MLS).
12 months · 68 sales · MIAMI REALTORS® MLS
Median days on market · condominiums
110 days
A year earlier: 84 days
If you sell a condominium in the islands, plan for about 16 weeks: the typical one took 110 days to sell in the 12 months to September 30, 2026 (MIAMI REALTORS® MLS).
12 months · 68 sales · MIAMI REALTORS® MLS
Median sale price · townhouses
4 sales, too few for a median
A year earlier: 2 sales
Only 4 townhouses sold in the islands in the 12 months to September 30, 2026: too few for a fair median, so each sale is listed in the table below (MIAMI REALTORS® MLS).
12 months · 4 sales · MIAMI REALTORS® MLS
Closed sales
4
A year earlier: 2
4 townhouses sold in the islands in the 12 months to September 30, 2026, fewer than one a month, against 2 the 12 months before (MIAMI REALTORS® MLS).
12 months · 4 sales · MIAMI REALTORS® MLS
On the water, 42 houses sold at a median of $18,509,000; off it, 32 at $5,025,000.
On the water, 66 condominiums sold; off it, 2.
On the water, 4 townhouses sold; off it, 0.
Full report for the islands →Median sale price · single-family
$2,950,000
A year earlier: $1,780,000 · ▲ 65.7%
If you own a house in North Beach, this is your yardstick: half of the 63 houses sold there in the 12 months to September 30, 2026 closed above $2,950,000 and half below, against $4,200,000 across Miami Beach (MIAMI REALTORS® MLS).
12 months · 63 sales · MIAMI REALTORS® MLS
Closed sales
63
A year earlier: 59
63 houses sold in North Beach in the 12 months to September 30, 2026, about 5 a month, against 59 the 12 months before (MIAMI REALTORS® MLS).
12 months · 63 sales · MIAMI REALTORS® MLS
Median price per sq ft · single-family
$1,049
A year earlier: $775 · ▲ 35.4%
To compare homes of different sizes, look at the price per square foot: a house in North Beach sold for a median $1,049 in the 12 months to September 30, 2026, so 2,000 Sq.Ft at that rate comes to about $2,100,000 (MIAMI REALTORS® MLS).
12 months · 63 sales · MIAMI REALTORS® MLS
Median days on market · single-family
114 days
A year earlier: 66 days
If you sell a house in North Beach, plan for about 16 weeks: the typical one took 114 days to sell in the 12 months to September 30, 2026 (MIAMI REALTORS® MLS).
12 months · 63 sales · MIAMI REALTORS® MLS
Median sale price · condominiums
$342,250
A year earlier: $355,000 · ▼ 3.6%
If you own a condominium in North Beach, this is your yardstick: half of the 318 condominiums sold there in the 12 months to September 30, 2026 closed above $342,250 and half below, against $499,000 across Miami Beach (MIAMI REALTORS® MLS).
12 months · 318 sales · MIAMI REALTORS® MLS
Closed sales
318
A year earlier: 279
318 condominiums sold in North Beach in the 12 months to September 30, 2026, about 27 a month, against 279 the 12 months before (MIAMI REALTORS® MLS).
12 months · 318 sales · MIAMI REALTORS® MLS
Median price per sq ft · condominiums
$385
A year earlier: $459 · ▼ 16.1%
To compare homes of different sizes, look at the price per square foot: a condominium in North Beach sold for a median $385 in the 12 months to September 30, 2026, so 1,000 Sq.Ft at that rate comes to about $390,000 (MIAMI REALTORS® MLS).
12 months · 318 sales · MIAMI REALTORS® MLS
Median days on market · condominiums
76 days
A year earlier: 59 days
If you sell a condominium in North Beach, plan for about 11 weeks: the typical one took 76 days to sell in the 12 months to September 30, 2026 (MIAMI REALTORS® MLS).
12 months · 318 sales · MIAMI REALTORS® MLS
Median sale price · townhouses
9 sales, too few for a median
A year earlier: 11 sales
Only 9 townhouses sold in North Beach in the 12 months to September 30, 2026: too few for a fair median, so each sale is listed in the table below (MIAMI REALTORS® MLS).
12 months · 9 sales · MIAMI REALTORS® MLS
Closed sales
9
A year earlier: 11
9 townhouses sold in North Beach in the 12 months to September 30, 2026, about one a month, against 11 the 12 months before (MIAMI REALTORS® MLS).
12 months · 9 sales · MIAMI REALTORS® MLS
On the water, 40 houses sold at a median of $5,075,000; off it, 23 at $1,175,000.
In a building on the water, 204 condominiums sold at a median of $483,250; off it, 114 at $245,000.
On the water, 6 townhouses sold; off it, 3.
Full report for North Beach →Median sale price · single-family
11 sales, too few for a median
A year earlier: 7 sales
Only 11 houses sold in South Beach in the 12 months to September 30, 2026: too few for a fair median, so each sale is listed in the table below (MIAMI REALTORS® MLS).
12 months · 11 sales · MIAMI REALTORS® MLS
Closed sales
11
A year earlier: 7
11 houses sold in South Beach in the 12 months to September 30, 2026, about one a month, against 7 the 12 months before (MIAMI REALTORS® MLS).
12 months · 11 sales · MIAMI REALTORS® MLS
Median sale price · condominiums
$456,250
A year earlier: $427,500 · ▲ 6.7%
If you own a condominium in South Beach, this is your yardstick: half of the 882 condominiums sold there in the 12 months to September 30, 2026 closed above $456,250 and half below, against $499,000 across Miami Beach (MIAMI REALTORS® MLS).
12 months · 882 sales · MIAMI REALTORS® MLS
Closed sales
882
A year earlier: 774
882 condominiums sold in South Beach in the 12 months to September 30, 2026, about 74 a month, against 774 the 12 months before (MIAMI REALTORS® MLS).
12 months · 882 sales · MIAMI REALTORS® MLS
Median price per sq ft · condominiums
$591
A year earlier: $605 · ▼ 2.3%
To compare homes of different sizes, look at the price per square foot: a condominium in South Beach sold for a median $591 in the 12 months to September 30, 2026, so 1,000 Sq.Ft at that rate comes to about $590,000 (MIAMI REALTORS® MLS).
12 months · 882 sales · MIAMI REALTORS® MLS
Median days on market · condominiums
84 days
A year earlier: 70.5 days
If you sell a condominium in South Beach, plan for about 12 weeks: the typical one took 84 days to sell in the 12 months to September 30, 2026 (MIAMI REALTORS® MLS).
12 months · 882 sales · MIAMI REALTORS® MLS
Median sale price · townhouses
8 sales, too few for a median
A year earlier: 12 sales
Only 8 townhouses sold in South Beach in the 12 months to September 30, 2026: too few for a fair median, so each sale is listed in the table below (MIAMI REALTORS® MLS).
12 months · 8 sales · MIAMI REALTORS® MLS
Closed sales
8
A year earlier: 12
8 townhouses sold in South Beach in the 12 months to September 30, 2026, about one a month, against 12 the 12 months before (MIAMI REALTORS® MLS).
12 months · 8 sales · MIAMI REALTORS® MLS
None of the 11 houses was on the water.
In a building on the water, 438 condominiums sold at a median of $865,000; off it, 444 at $300,000.
On the water, 3 townhouses sold; off it, 5.
Full report for South Beach →| Neighborhood | Closed sales | Median sale price | Price per square foot | Median vs a year earlier | Median days |
|---|---|---|---|---|---|
| South Beach | 11 | — | — | — | — |
| Ocean Beach Addition No. 3 | 5 | — | — | — | — |
Palm ViewEach sale (4)
| 4 | — | — | — | — |
| Elsewhere in South Beach | 2 | — | — | — | — |
| Mid-Beach | 105 | $3,400,000 | $1,135 | ▲ 20.4% | 99 |
| Nautilus | 22 | $3,025,000 | $1,022 | ▲ 16.3% | 91 |
| Beach View | 19 | — | — | — | — |
| La Gorce Golf | 16 | — | — | — | — |
| Orchard | 10 | — | — | — | — |
| Sunset Lake | 8 | — | — | — | — |
| Mid Golf | 7 | — | — | — | — |
| Lake View | 6 | — | — | — | — |
| Surprise Lake | 6 | — | — | — | — |
Flamingo TerraceEach sale (4)
| 4 | — | — | — | — |
| Elsewhere in Mid-Beach | 7 | — | — | — | — |
| North Beach | 63 | $2,950,000 | $1,049 | ▲ 65.7% | 114 |
| Biscayne Point | 20 | $4,125,000 | $1,362 | — | 169.5 |
| Normandy Shores | 15 | — | — | — | — |
| Normandy Isles | 14 | — | — | — | — |
| Biscayne Beach | 11 | — | — | — | — |
Altos del MarEach sale (1)
| 1 | — | — | — | — |
| Elsewhere in North Beach | 2 | — | — | — | — |
| The islands | 74 | $11,150,000 | $2,481 | ▲ 12.7% | 96.5 |
| Venetian Islands | 40 | $9,212,500 | $2,677 | ▲ 10.3% | 105.5 |
| Sunset Islands | 13 | — | — | — | — |
| Palm Island | 6 | — | — | — | — |
| Hibiscus Island | 8 | — | — | — | — |
| Star Island | 0 | — | — | — | — |
La Gorce IslandEach sale (3)
| 3 | — | — | — | — |
Allison IslandEach sale (4)
| 4 | — | — | — | — |
| Neighborhood | Closed sales | Median sale price | Price per square foot | Median vs a year earlier | Median days |
|---|---|---|---|---|---|
| South Beach | 0 | — | — | — | — |
| Ocean Beach Addition No. 3 | 0 | — | — | — | — |
| Palm View | 0 | — | — | — | — |
| Elsewhere in South Beach | 0 | — | — | — | — |
| Mid-Beach | 16 | — | — | — | — |
| Nautilus | 3 | — | — | — | — |
| Beach View | 7 | — | — | — | — |
| La Gorce Golf | 3 | — | — | — | — |
| Orchard | 0 | — | — | — | — |
| Sunset Lake | 0 | — | — | — | — |
| Mid Golf | 1 | — | — | — | — |
| Lake View | 0 | — | — | — | — |
| Surprise Lake | 0 | — | — | — | — |
Flamingo TerraceEach sale (1)
| 1 | — | — | — | — |
| Elsewhere in Mid-Beach | 1 | — | — | — | — |
| North Beach | 40 | $5,075,000 | $1,404 | ▲ 9.7% | 147 |
| Biscayne Point | 18 | — | — | — | — |
| Normandy Shores | 9 | — | — | — | — |
| Normandy Isles | 3 | — | — | — | — |
| Biscayne Beach | 7 | — | — | — | — |
Altos del MarEach sale (1)
| 1 | — | — | — | — |
| Elsewhere in North Beach | 2 | — | — | — | — |
| The islands | 42 | $18,509,000 | $3,472 | ▲ 2.8% | 118.5 |
| Venetian Islands | 22 | $16,044,444 | $3,531 | — | 43 |
| Sunset Islands | 6 | — | — | — | — |
| Palm Island | 4 | — | — | — | — |
| Hibiscus Island | 5 | — | — | — | — |
| Star Island | 0 | — | — | — | — |
La Gorce IslandEach sale (1)
| 1 | — | — | — | — |
Allison IslandEach sale (4)
| 4 | — | — | — | — |
| Neighborhood | Closed sales | Median sale price | Price per square foot | Median vs a year earlier | Median days |
|---|---|---|---|---|---|
| South Beach | 11 | — | — | — | — |
| Ocean Beach Addition No. 3 | 5 | — | — | — | — |
Palm ViewEach sale (4)
| 4 | — | — | — | — |
| Elsewhere in South Beach | 2 | — | — | — | — |
| Mid-Beach | 89 | $2,900,000 | $1,067 | ▲ 13.1% | 86 |
| Nautilus | 19 | — | — | — | — |
| Beach View | 12 | — | — | — | — |
| La Gorce Golf | 13 | — | — | — | — |
| Orchard | 10 | — | — | — | — |
| Sunset Lake | 8 | — | — | — | — |
| Mid Golf | 6 | — | — | — | — |
| Lake View | 6 | — | — | — | — |
| Surprise Lake | 6 | — | — | — | — |
Flamingo TerraceEach sale (3)
| 3 | — | — | — | — |
| Elsewhere in Mid-Beach | 6 | — | — | — | — |
| North Beach | 23 | $1,175,000 | $617 | ▲ 2.2% | 73 |
| Biscayne Point | 2 | — | — | — | — |
| Normandy Shores | 6 | — | — | — | — |
| Normandy Isles | 11 | — | — | — | — |
| Biscayne Beach | 4 | — | — | — | — |
| Altos del Mar | 0 | — | — | — | — |
| Elsewhere in North Beach | 0 | — | — | — | — |
| The islands | 32 | $5,025,000 | $1,630 | ▲ 2.6% | 85 |
| Venetian Islands | 18 | — | — | — | — |
| Sunset Islands | 7 | — | — | — | — |
| Palm Island | 2 | — | — | — | — |
| Hibiscus Island | 3 | — | — | — | — |
| Star Island | 0 | — | — | — | — |
La Gorce IslandEach sale (2)
| 2 | — | — | — | — |
| Allison Island | 0 | — | — | — | — |
| Neighborhood | Closed sales | Median sale price | Price per square foot | Median vs a year earlier | Median days |
|---|---|---|---|---|---|
| South Beach | 882 | $456,250 | $591 | ▲ 6.7% | 84 |
Ocean Beach Addition No. 3Each sale (1)
| 1 | — | — | — | — |
| Palm View | 0 | — | — | — | — |
| Elsewhere in South Beach | 881 | $455,000 | $591 | ▲ 6.4% | 84 |
| Mid-Beach | 347 | $635,000 | $553 | ▲ 11.9% | 78 |
| Nautilus | 0 | — | — | — | — |
| Beach View | 0 | — | — | — | — |
| La Gorce Golf | 0 | — | — | — | — |
| Orchard | 0 | — | — | — | — |
| Sunset Lake | 0 | — | — | — | — |
| Mid Golf | 0 | — | — | — | — |
| Lake View | 0 | — | — | — | — |
| Surprise Lake | 0 | — | — | — | — |
| Flamingo Terrace | 0 | — | — | — | — |
| Elsewhere in Mid-Beach | 347 | $635,000 | $553 | ▲ 11.9% | 78 |
| North Beach | 318 | $342,250 | $385 | ▼ 3.6% | 76 |
| Biscayne Point | 0 | — | — | — | — |
| Normandy Shores | 0 | — | — | — | — |
| Normandy Isles | 0 | — | — | — | — |
| Biscayne Beach | 0 | — | — | — | — |
| Altos del Mar | 0 | — | — | — | — |
| Elsewhere in North Beach | 318 | $342,250 | $385 | ▼ 2.9% | 76 |
| The islands | 68 | $1,145,000 | $810 | ▲ 17.6% | 110 |
| Venetian Islands | 59 | $1,033,000 | $771 | ▲ 6.1% | 84 |
| Sunset Islands | 0 | — | — | — | — |
| Palm Island | 0 | — | — | — | — |
Hibiscus IslandEach sale (1)
| 1 | — | — | — | — |
| Star Island | 0 | — | — | — | — |
| La Gorce Island | 0 | — | — | — | — |
| Allison Island | 8 | — | — | — | — |
| Neighborhood | Closed sales | Median sale price | Price per square foot | Median vs a year earlier | Median days |
|---|---|---|---|---|---|
| South Beach | 438 | $865,000 | $919 | ▲ 3.0% | 92 |
| Ocean Beach Addition No. 3 | 0 | — | — | — | — |
| Palm View | 0 | — | — | — | — |
| Elsewhere in South Beach | 438 | $865,000 | $919 | ▲ 3.0% | 92 |
| Mid-Beach | 312 | $670,000 | $556 | ▲ 15.5% | 81.5 |
| Nautilus | 0 | — | — | — | — |
| Beach View | 0 | — | — | — | — |
| La Gorce Golf | 0 | — | — | — | — |
| Orchard | 0 | — | — | — | — |
| Sunset Lake | 0 | — | — | — | — |
| Mid Golf | 0 | — | — | — | — |
| Lake View | 0 | — | — | — | — |
| Surprise Lake | 0 | — | — | — | — |
| Flamingo Terrace | 0 | — | — | — | — |
| Elsewhere in Mid-Beach | 312 | $670,000 | $556 | ▲ 15.5% | 81.5 |
| North Beach | 204 | $483,250 | $464 | ▼ 5.2% | 86.5 |
| Biscayne Point | 0 | — | — | — | — |
| Normandy Shores | 0 | — | — | — | — |
| Normandy Isles | 0 | — | — | — | — |
| Biscayne Beach | 0 | — | — | — | — |
| Altos del Mar | 0 | — | — | — | — |
| Elsewhere in North Beach | 204 | $483,250 | $464 | ▼ 5.2% | 86.5 |
| The islands | 66 | $1,175,000 | $822 | ▲ 20.8% | 119.5 |
| Venetian Islands | 57 | $1,121,000 | $777 | ▲ 15.3% | 89 |
| Sunset Islands | 0 | — | — | — | — |
| Palm Island | 0 | — | — | — | — |
Hibiscus IslandEach sale (1)
| 1 | — | — | — | — |
| Star Island | 0 | — | — | — | — |
| La Gorce Island | 0 | — | — | — | — |
| Allison Island | 8 | — | — | — | — |
| Neighborhood | Closed sales | Median sale price | Price per square foot | Median vs a year earlier | Median days |
|---|---|---|---|---|---|
| South Beach | 444 | $300,000 | $462 | ▼ 1.6% | 77 |
Ocean Beach Addition No. 3Each sale (1)
| 1 | — | — | — | — |
| Palm View | 0 | — | — | — | — |
| Elsewhere in South Beach | 443 | $300,000 | $462 | ▼ 1.6% | 77 |
| Mid-Beach | 35 | $335,000 | $500 | ▲ 3.1% | 75 |
| Nautilus | 0 | — | — | — | — |
| Beach View | 0 | — | — | — | — |
| La Gorce Golf | 0 | — | — | — | — |
| Orchard | 0 | — | — | — | — |
| Sunset Lake | 0 | — | — | — | — |
| Mid Golf | 0 | — | — | — | — |
| Lake View | 0 | — | — | — | — |
| Surprise Lake | 0 | — | — | — | — |
| Flamingo Terrace | 0 | — | — | — | — |
| Elsewhere in Mid-Beach | 35 | $335,000 | $500 | ▲ 3.1% | 75 |
| North Beach | 114 | $245,000 | $321 | ▼ 8.4% | 60 |
| Biscayne Point | 0 | — | — | — | — |
| Normandy Shores | 0 | — | — | — | — |
| Normandy Isles | 0 | — | — | — | — |
| Biscayne Beach | 0 | — | — | — | — |
| Altos del Mar | 0 | — | — | — | — |
| Elsewhere in North Beach | 114 | $245,000 | $321 | ▼ 7.5% | 60 |
| The islands | 2 | — | — | — | — |
| Venetian Islands | 2 | — | — | — | — |
| Sunset Islands | 0 | — | — | — | — |
| Palm Island | 0 | — | — | — | — |
| Hibiscus Island | 0 | — | — | — | — |
| Star Island | 0 | — | — | — | — |
| La Gorce Island | 0 | — | — | — | — |
| Allison Island | 0 | — | — | — | — |
| Neighborhood | Closed sales | Median sale price | Price per square foot | Median vs a year earlier | Median days |
|---|---|---|---|---|---|
| South Beach | 8 | — | — | — | — |
| Ocean Beach Addition No. 3 | 0 | — | — | — | — |
| Palm View | 0 | — | — | — | — |
| Elsewhere in South Beach | 8 | — | — | — | — |
| Mid-Beach | 0 | — | — | — | — |
| Nautilus | 0 | — | — | — | — |
| Beach View | 0 | — | — | — | — |
| La Gorce Golf | 0 | — | — | — | — |
| Orchard | 0 | — | — | — | — |
| Sunset Lake | 0 | — | — | — | — |
| Mid Golf | 0 | — | — | — | — |
| Lake View | 0 | — | — | — | — |
| Surprise Lake | 0 | — | — | — | — |
| Flamingo Terrace | 0 | — | — | — | — |
| Elsewhere in Mid-Beach | 0 | — | — | — | — |
| North Beach | 9 | — | — | — | — |
| Biscayne Point | 0 | — | — | — | — |
| Normandy Shores | 5 | — | — | — | — |
| Normandy Isles | 0 | — | — | — | — |
Biscayne BeachEach sale (1)
| 1 | — | — | — | — |
Altos del MarEach sale (1)
| 1 | — | — | — | — |
| Elsewhere in North Beach | 2 | — | — | — | — |
| The islands | 4 | — | — | — | — |
| Venetian Islands | 0 | — | — | — | — |
| Sunset Islands | 0 | — | — | — | — |
| Palm Island | 0 | — | — | — | — |
| Hibiscus Island | 0 | — | — | — | — |
| Star Island | 0 | — | — | — | — |
| La Gorce Island | 0 | — | — | — | — |
Allison IslandEach sale (4)
| 4 | — | — | — | — |
| Neighborhood | Closed sales | Median sale price | Price per square foot | Median vs a year earlier | Median days |
|---|---|---|---|---|---|
| South Beach | 3 | — | — | — | — |
| Ocean Beach Addition No. 3 | 0 | — | — | — | — |
| Palm View | 0 | — | — | — | — |
| Elsewhere in South Beach | 3 | — | — | — | — |
| Mid-Beach | 0 | — | — | — | — |
| Nautilus | 0 | — | — | — | — |
| Beach View | 0 | — | — | — | — |
| La Gorce Golf | 0 | — | — | — | — |
| Orchard | 0 | — | — | — | — |
| Sunset Lake | 0 | — | — | — | — |
| Mid Golf | 0 | — | — | — | — |
| Lake View | 0 | — | — | — | — |
| Surprise Lake | 0 | — | — | — | — |
| Flamingo Terrace | 0 | — | — | — | — |
| Elsewhere in Mid-Beach | 0 | — | — | — | — |
| North Beach | 6 | — | — | — | — |
| Biscayne Point | 0 | — | — | — | — |
| Normandy Shores | 4 | — | — | — | — |
| Normandy Isles | 0 | — | — | — | — |
| Biscayne Beach | 0 | — | — | — | — |
| Altos del Mar | 0 | — | — | — | — |
| Elsewhere in North Beach | 2 | — | — | — | — |
| The islands | 4 | — | — | — | — |
| Venetian Islands | 0 | — | — | — | — |
| Sunset Islands | 0 | — | — | — | — |
| Palm Island | 0 | — | — | — | — |
| Hibiscus Island | 0 | — | — | — | — |
| Star Island | 0 | — | — | — | — |
| La Gorce Island | 0 | — | — | — | — |
Allison IslandEach sale (4)
| 4 | — | — | — | — |
| Neighborhood | Closed sales | Median sale price | Price per square foot | Median vs a year earlier | Median days |
|---|---|---|---|---|---|
| South Beach | 5 | — | — | — | — |
| Ocean Beach Addition No. 3 | 0 | — | — | — | — |
| Palm View | 0 | — | — | — | — |
| Elsewhere in South Beach | 5 | — | — | — | — |
| Mid-Beach | 0 | — | — | — | — |
| Nautilus | 0 | — | — | — | — |
| Beach View | 0 | — | — | — | — |
| La Gorce Golf | 0 | — | — | — | — |
| Orchard | 0 | — | — | — | — |
| Sunset Lake | 0 | — | — | — | — |
| Mid Golf | 0 | — | — | — | — |
| Lake View | 0 | — | — | — | — |
| Surprise Lake | 0 | — | — | — | — |
| Flamingo Terrace | 0 | — | — | — | — |
| Elsewhere in Mid-Beach | 0 | — | — | — | — |
| North Beach | 3 | — | — | — | — |
| Biscayne Point | 0 | — | — | — | — |
| Normandy Shores | 1 | — | — | — | — |
| Normandy Isles | 0 | — | — | — | — |
Biscayne BeachEach sale (1)
| 1 | — | — | — | — |
Altos del MarEach sale (1)
| 1 | — | — | — | — |
| Elsewhere in North Beach | 0 | — | — | — | — |
| The islands | 0 | — | — | — | — |
| Venetian Islands | 0 | — | — | — | — |
| Sunset Islands | 0 | — | — | — | — |
| Palm Island | 0 | — | — | — | — |
| Hibiscus Island | 0 | — | — | — | — |
| Star Island | 0 | — | — | — | — |
| La Gorce Island | 0 | — | — | — | — |
| Allison Island | 0 | — | — | — | — |
In the twelve months to September 30, 2026, 253 single-family homes closed in Miami Beach, against 389 in Coral Gables, by MIAMI REALTORS® MLS closed sales.
| Area | Median lot | Median house | Homes sold, 12 months | Median sale price, 12 months | Tax rate | Government | |
|---|---|---|---|---|---|---|---|
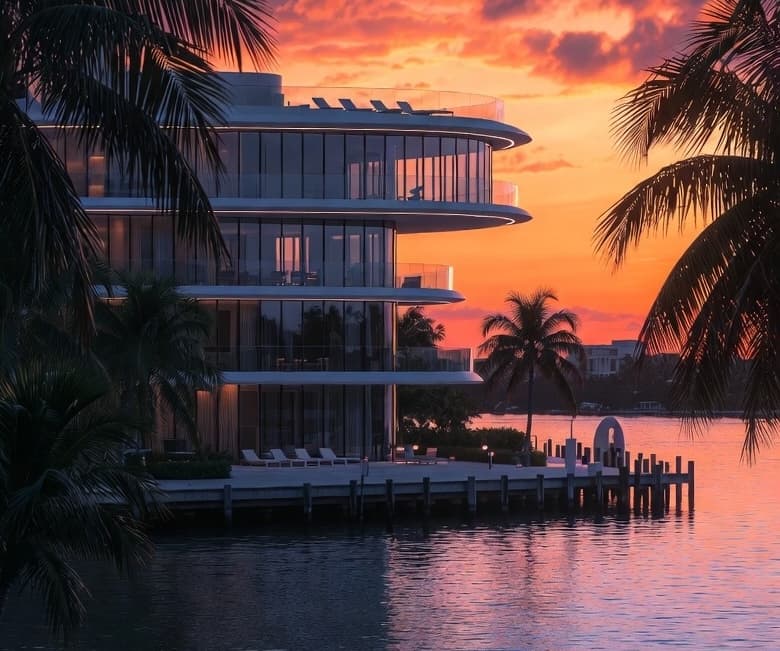 Miami BeachTHIS PAGE | 8,929 SF | 2,894 SF | 253 | $4,200,000 | 18.7601 mills | A city of its own | |
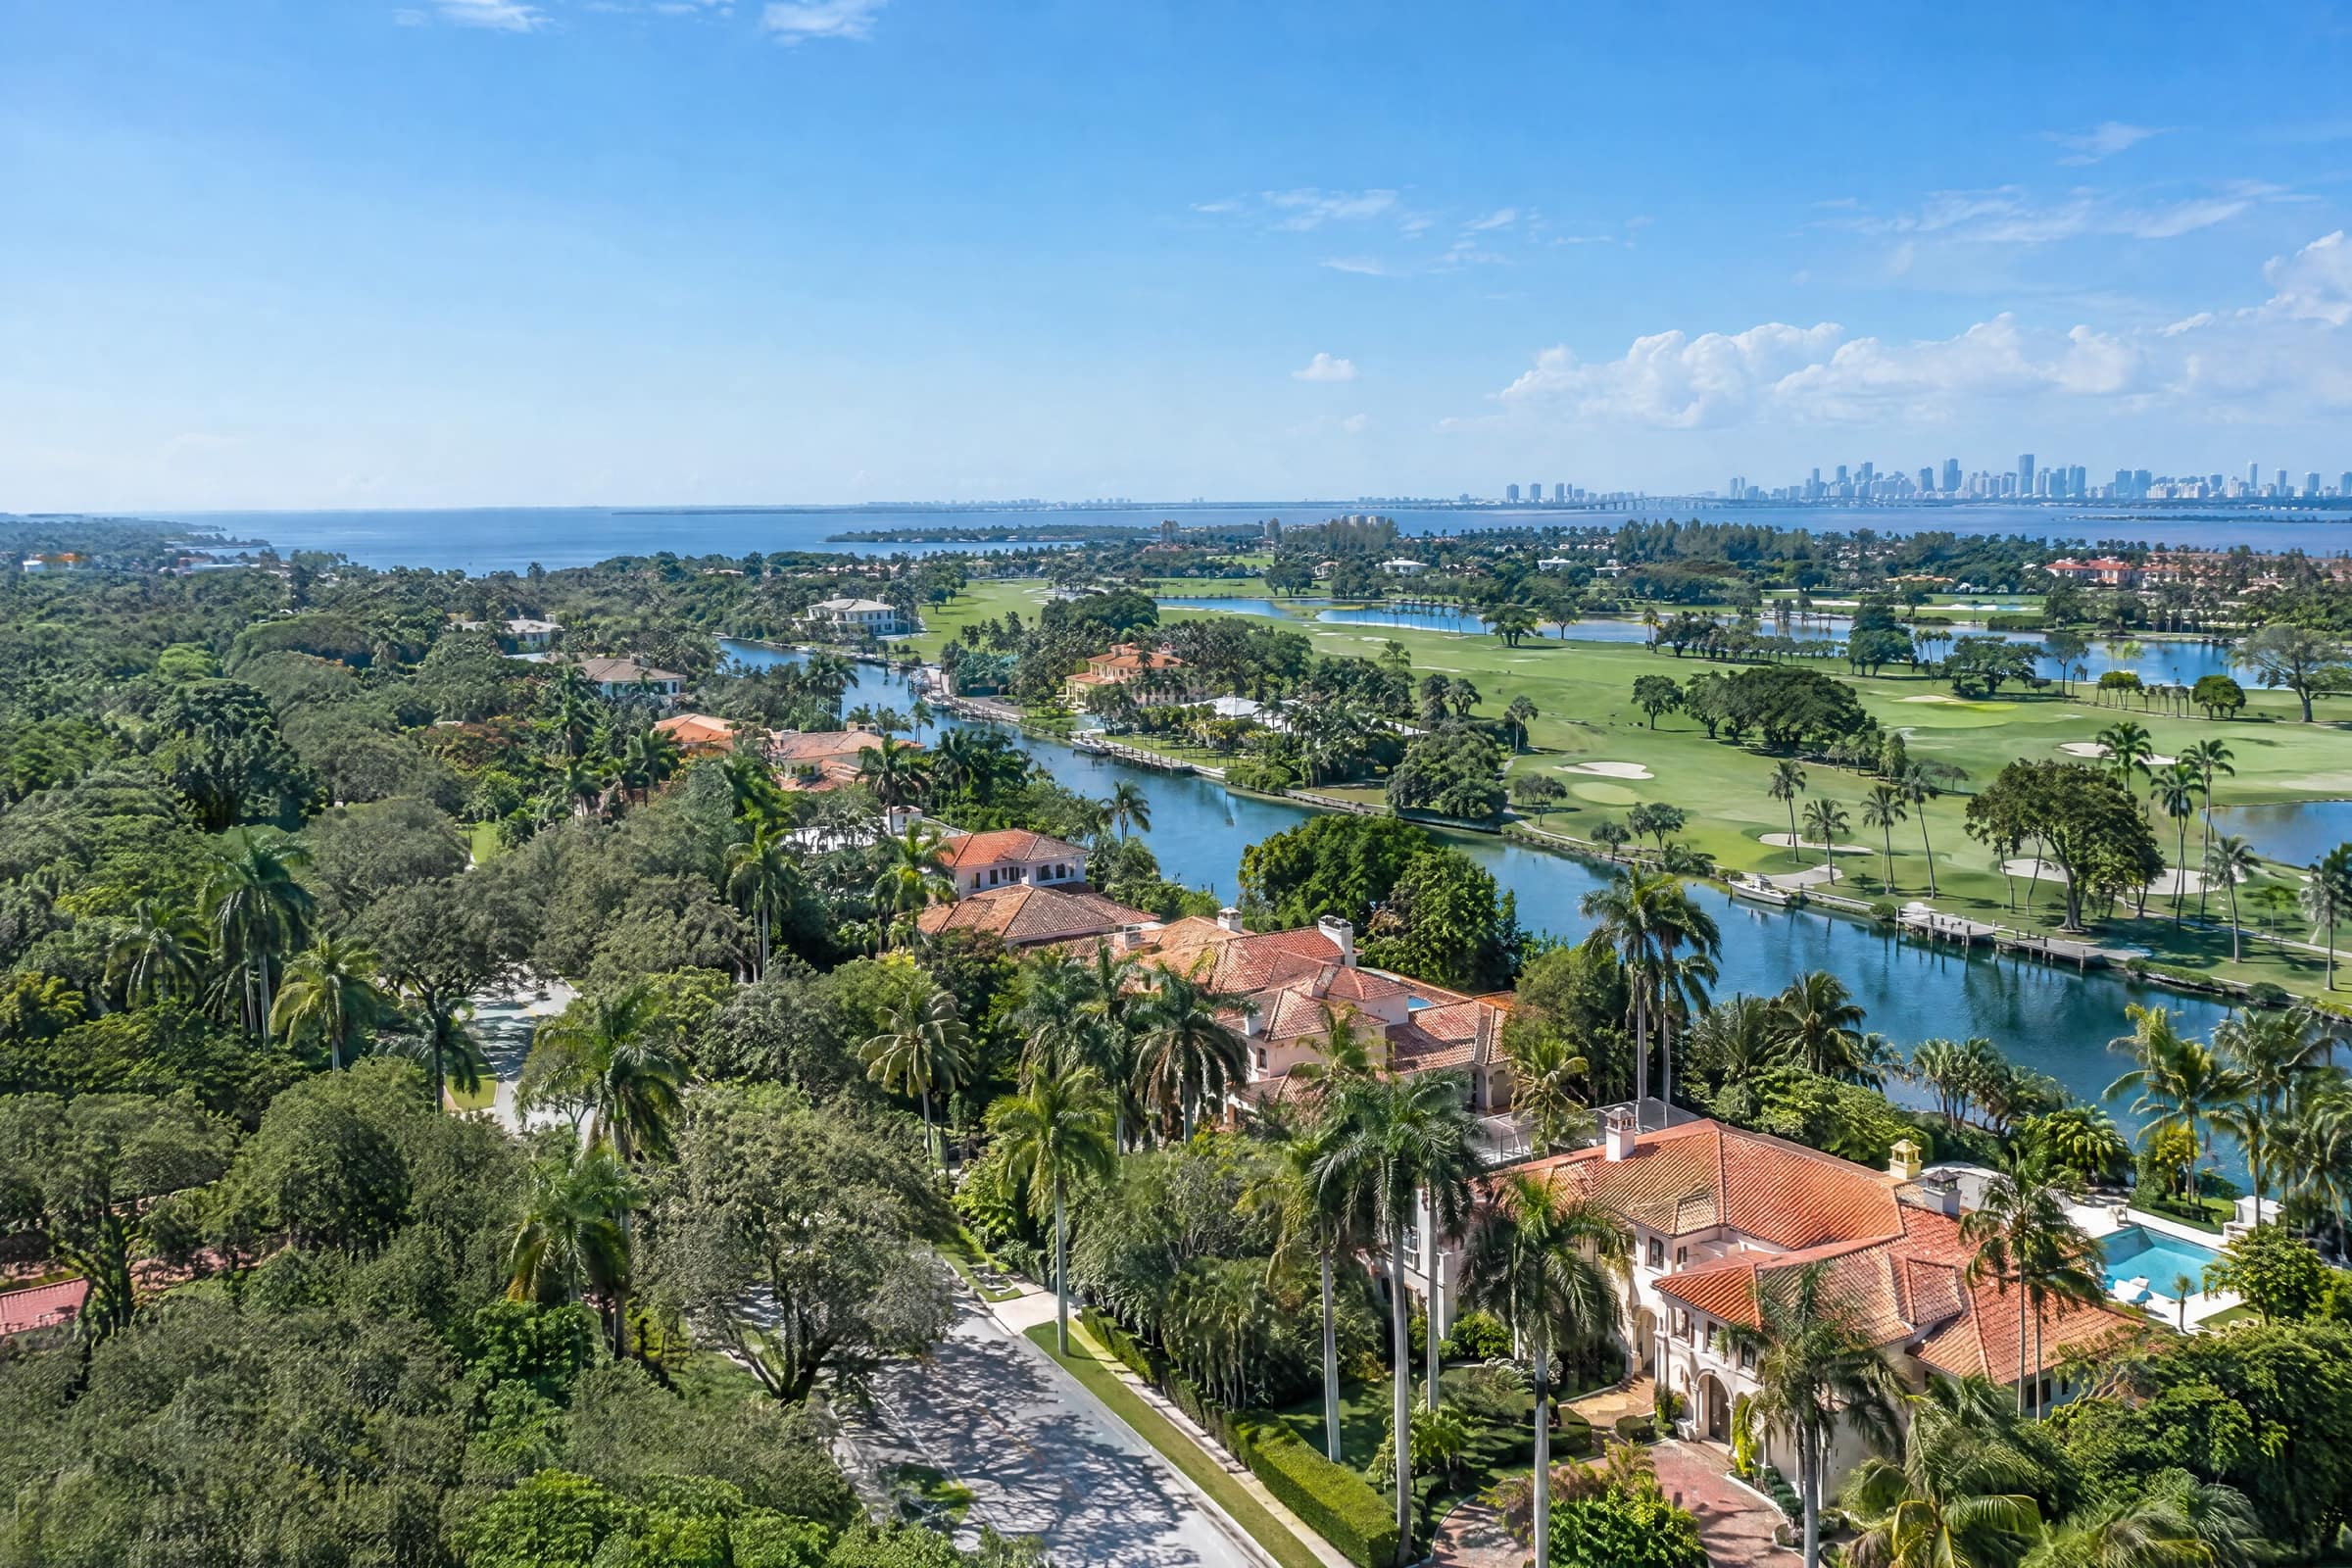 Coral GablesREFERENCE | 10,000 SF | 2,352 SF | 389 | $2,200,000 | 18.1852 mills | A city of its own | See Coral Gables → |
Sources: Miami-Dade County Property Appraiser, assessment year 2026, read October 4, 2026 (Miami Beach, Coral Gables); MIAMI REALTORS® MLS closed sales, 12 months to September 30, 2026; 2025 adopted millage. A dash is a median this site does not state from fewer than twenty sales.
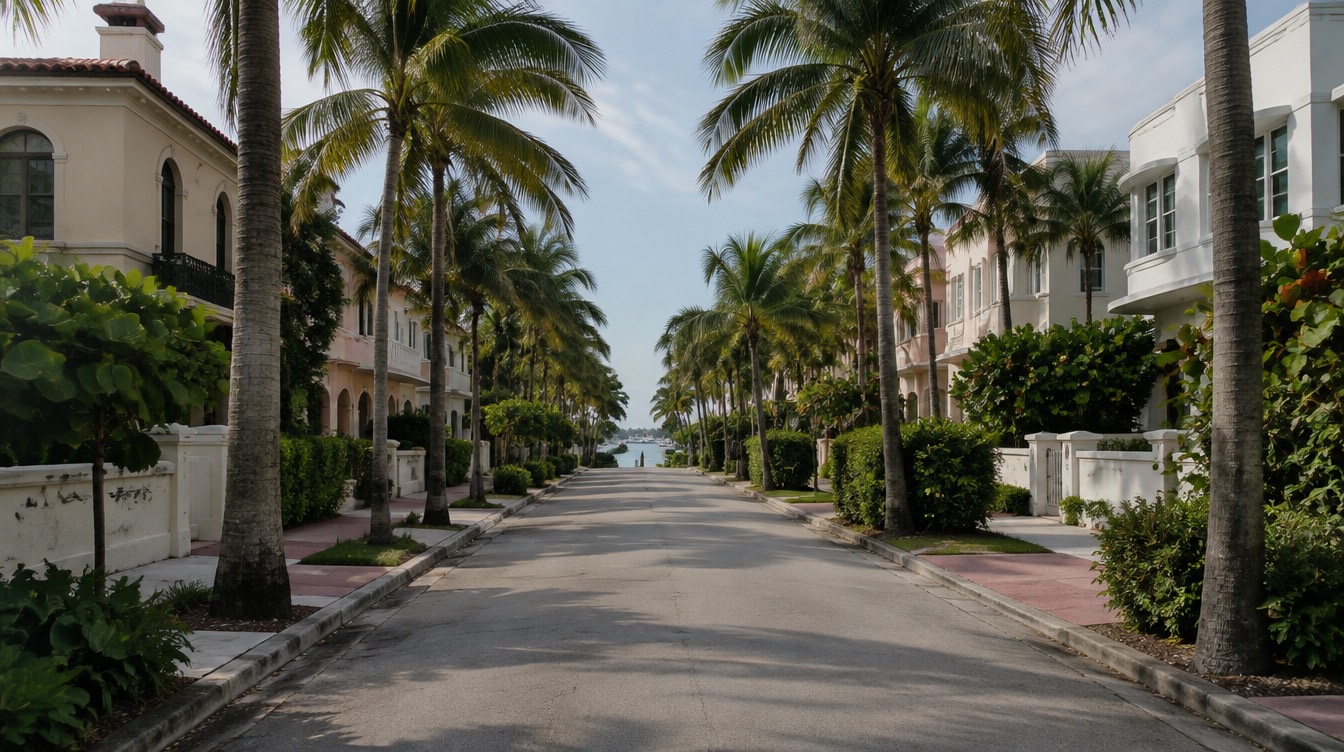
Miami Beach is one of Miami-Dade County's municipalities. Its parcels carry a folio that opens with 02, the County's code for the city. Surfside, Bal Harbour, Bay Harbor Islands, Indian Creek Village and North Bay Village are municipalities of their own, each with its own code.
Two things a listing can get wrong follow from that.
The Venetian Islands are six, and four are Miami Beach: Belle Isle, Rivo Alto, Di Lido and San Marino. San Marco Island and Biscayne Island are in the City of Miami, though they share ZIP code 33139 with South Beach.
"Miami Beach" on a listing is a mailing city. The folio is the jurisdiction, and the jurisdiction decides the tax rate, the zoning code, the permits and the rental rules.
The City uses the three names and publishes no written line between them. This site draws them by postal code, so every figure can be checked against the record: South Beach is 33139, Mid-Beach is 33140, and North Beach is 33141 with one block of 33154.
South Beach holds more than half of the city's condominium units and the fewest houses. Three of every four of its houses are on an island: Star, Palm, Hibiscus and the Venetian Islands.
Mid-Beach holds half of the city's houses, 2,443 of 4,834, and the oldest: the median was built in 1941. Its 30 lots of an acre or more are the most of the three areas.
North Beach holds the smallest house of the three, a median 2,275 SF. Most of its houses are on the Normandy Isles and Biscayne Point, and it holds nearly all of the city's townhouse parcels, 221 of 238.
The market report reads the city's sales in four areas, the islands apart: Miami Beach home prices by neighborhood
| Area | Condominium units | Single-family homes | On the islands | Median lot | Median house | Median year built | Built since 2015 |
|---|---|---|---|---|---|---|---|
| South Beach | 22,719 | 817 | 632 | 9,750 SF | 3,430 SF | 1948 | 149 |
| Mid-Beach | 11,224 | 2,443 | 190 | 9,034 SF | 3,148 SF | 1941 | 220 |
| North Beach | 9,091 | 1,574 | 126 | 8,000 SF | 2,275 SF | 1950 | 100 |
These lines tell you how Miami Beach's three areas differ by the County's record of assessment year 2026, read October 4, 2026: their condominium units, their houses, how many of those stand on the islands, and their median lot, size and year. It does not value a single home.
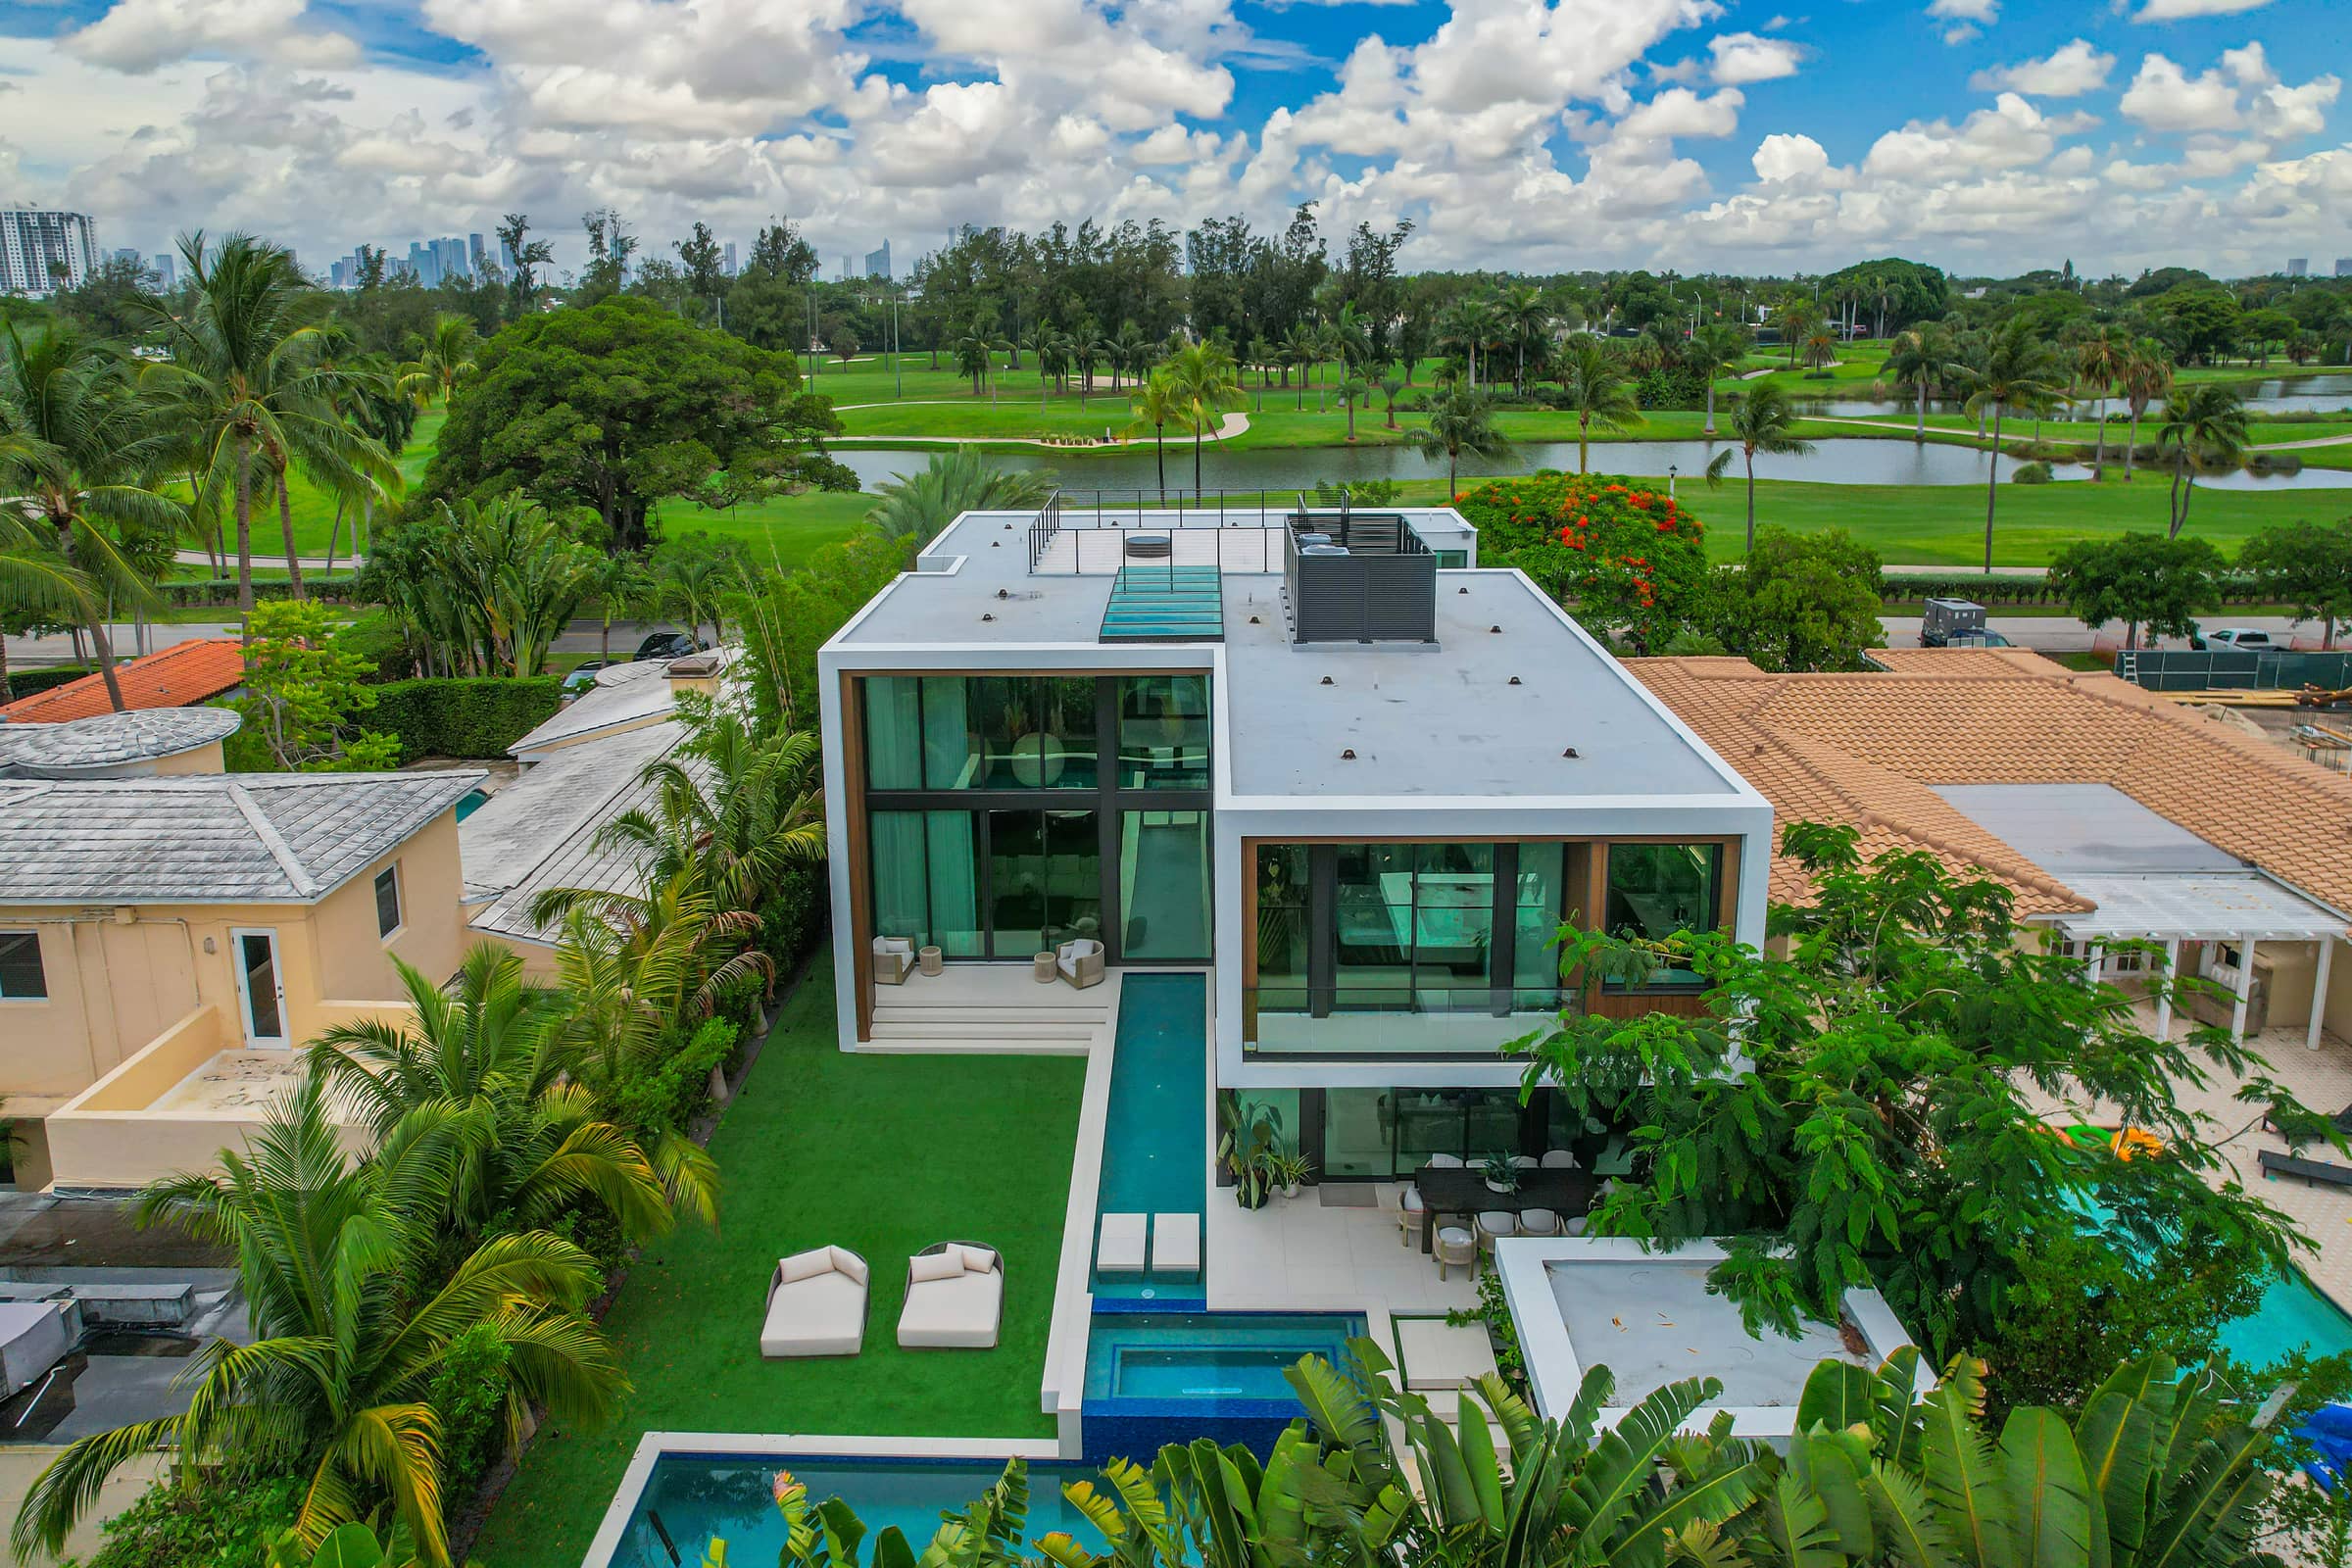
One house in five in Miami Beach stands on one of 13 islands in Biscayne Bay: Star Island, Palm Island, Hibiscus Island, four Venetian Islands, the four Sunset Islands, La Gorce Island and Allison Island. Together they hold 948 single-family homes, by the Miami-Dade Property Appraiser's record for assessment year 2026.
They are not one market. Star Island has 24 homes on a median lot of 48,266 SF. Di Lido Island has 148 on a median lot of 10,500 SF. The median house across the islands is 4,358 SF, against 2,894 SF for the city.
In the twelve months to September 30, 2026, houses on the islands closed at a median of $11,000,000, from 67 closed sales (closed sales the MIAMI REALTORS® MLS reported; this site's Miami Beach market report, data as of October 19, 2026).
Condominiums. 43,034 units in 927 condominiums, from buildings of fewer than ten units to towers of several hundred. More than half of the units, 22,719, are in South Beach. The record also holds 602 cooperative units and 1,201 hotel-condominium units, which are different forms of ownership and are not counted with the condominiums.
Single-family homes. 4,834, on a median lot of 8,929 SF. Half of all lots fall between 7,296 and 11,600 SF, and 54 are an acre or more.
Townhomes. 238 townhouse parcels in the record, 221 of them in North Beach.
In the twelve months to September 30, 2026, 253 houses, 1,615 condominiums and 21 townhouses closed in Miami Beach (closed sales the MIAMI REALTORS® MLS reported; this site's Miami Beach market report, data as of October 19, 2026).
Miami Beach homes and condominiums, by neighborhood →
These counts tell you what Miami Beach is made of, 43,034 condominium units and 4,834 single-family houses by the County's record of assessment year 2026, and how many of each kind sold in the twelve months to September 30, 2026. It does not value a single home.
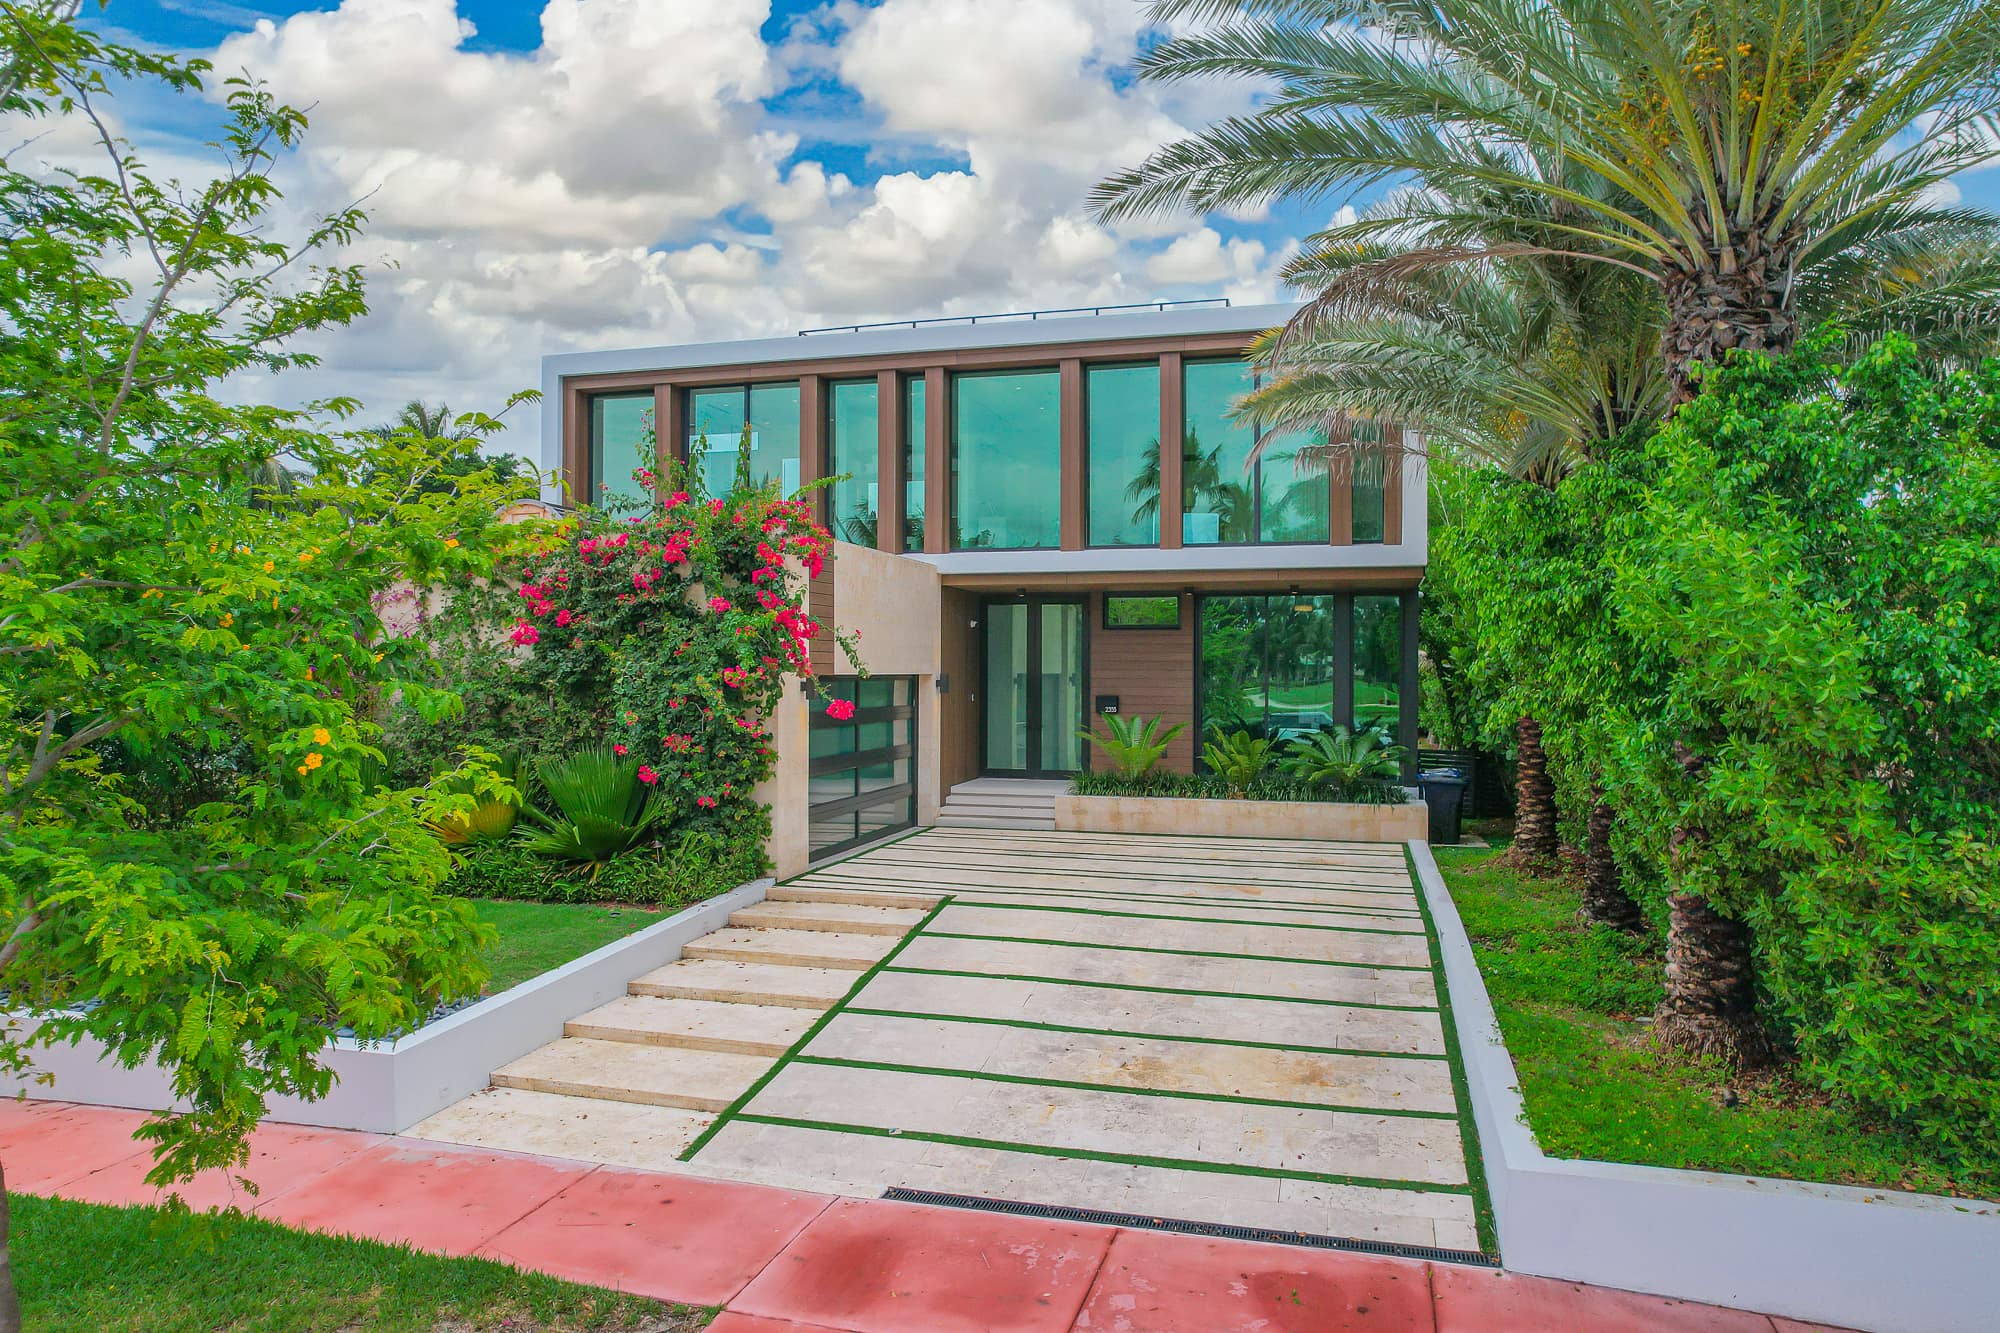
Short-term rentals. The City of Miami Beach states that vacation and short-term rentals, of less than six months and one day, are prohibited in all single-family homes and in many multifamily buildings in certain zoning districts. Where they are permitted, the City requires a Business Tax Receipt and a Resort Tax account. Whether a given unit may be rented by the night is a question of its zoning district.
Historic districts. The City lists 14 local historic districts, from Espanola Way and Ocean Drive–Collins Avenue, in the City's reports of 1986, to North Shore and Normandy Isles in 2018. The National Park Service records the Miami Beach Architectural District on the National Register of Historic Places.
Flooding. The City names its adaptation work as the installation of pump stations, the elevation of roads and other drainage improvements.
Government. A City Commission of 6 commissioners and a mayor, all elected, with a City Manager.
Property tax. Miami Beach's total rate was 18.7601 mills in 2025, against 18.1852 in Coral Gables (Miami-Dade Property Appraiser, 2025 Adopted Millage Rates).
469 single-family homes in the record were built in 2015 or later: 149 in South Beach, 220 in Mid-Beach and 100 in North Beach. On the islands the share is higher: 197 of 948 homes, one in five.
1,565 condominium units are in buildings the County dates 2015 or later. 197 residential lots are vacant.
These counts tell you how much of Miami Beach is new by the County's record of assessment year 2026: 469 houses built since 2015, and 1,565 condominium units in buildings dated 2015 or later. It does not value a single home.
Each row of the feed names its property type. In a city of nine condominium units to one house, the type is the first thing to read.
Read it beside the market report, which adds the events up by neighborhood and by type of home.
The feed shows each Miami Beach listing, sale and price change as the MIAMI REALTORS® MLS records it, in this site's Miami Beach zone. It tells you what is moving this week; the dated market report is where those events add up.
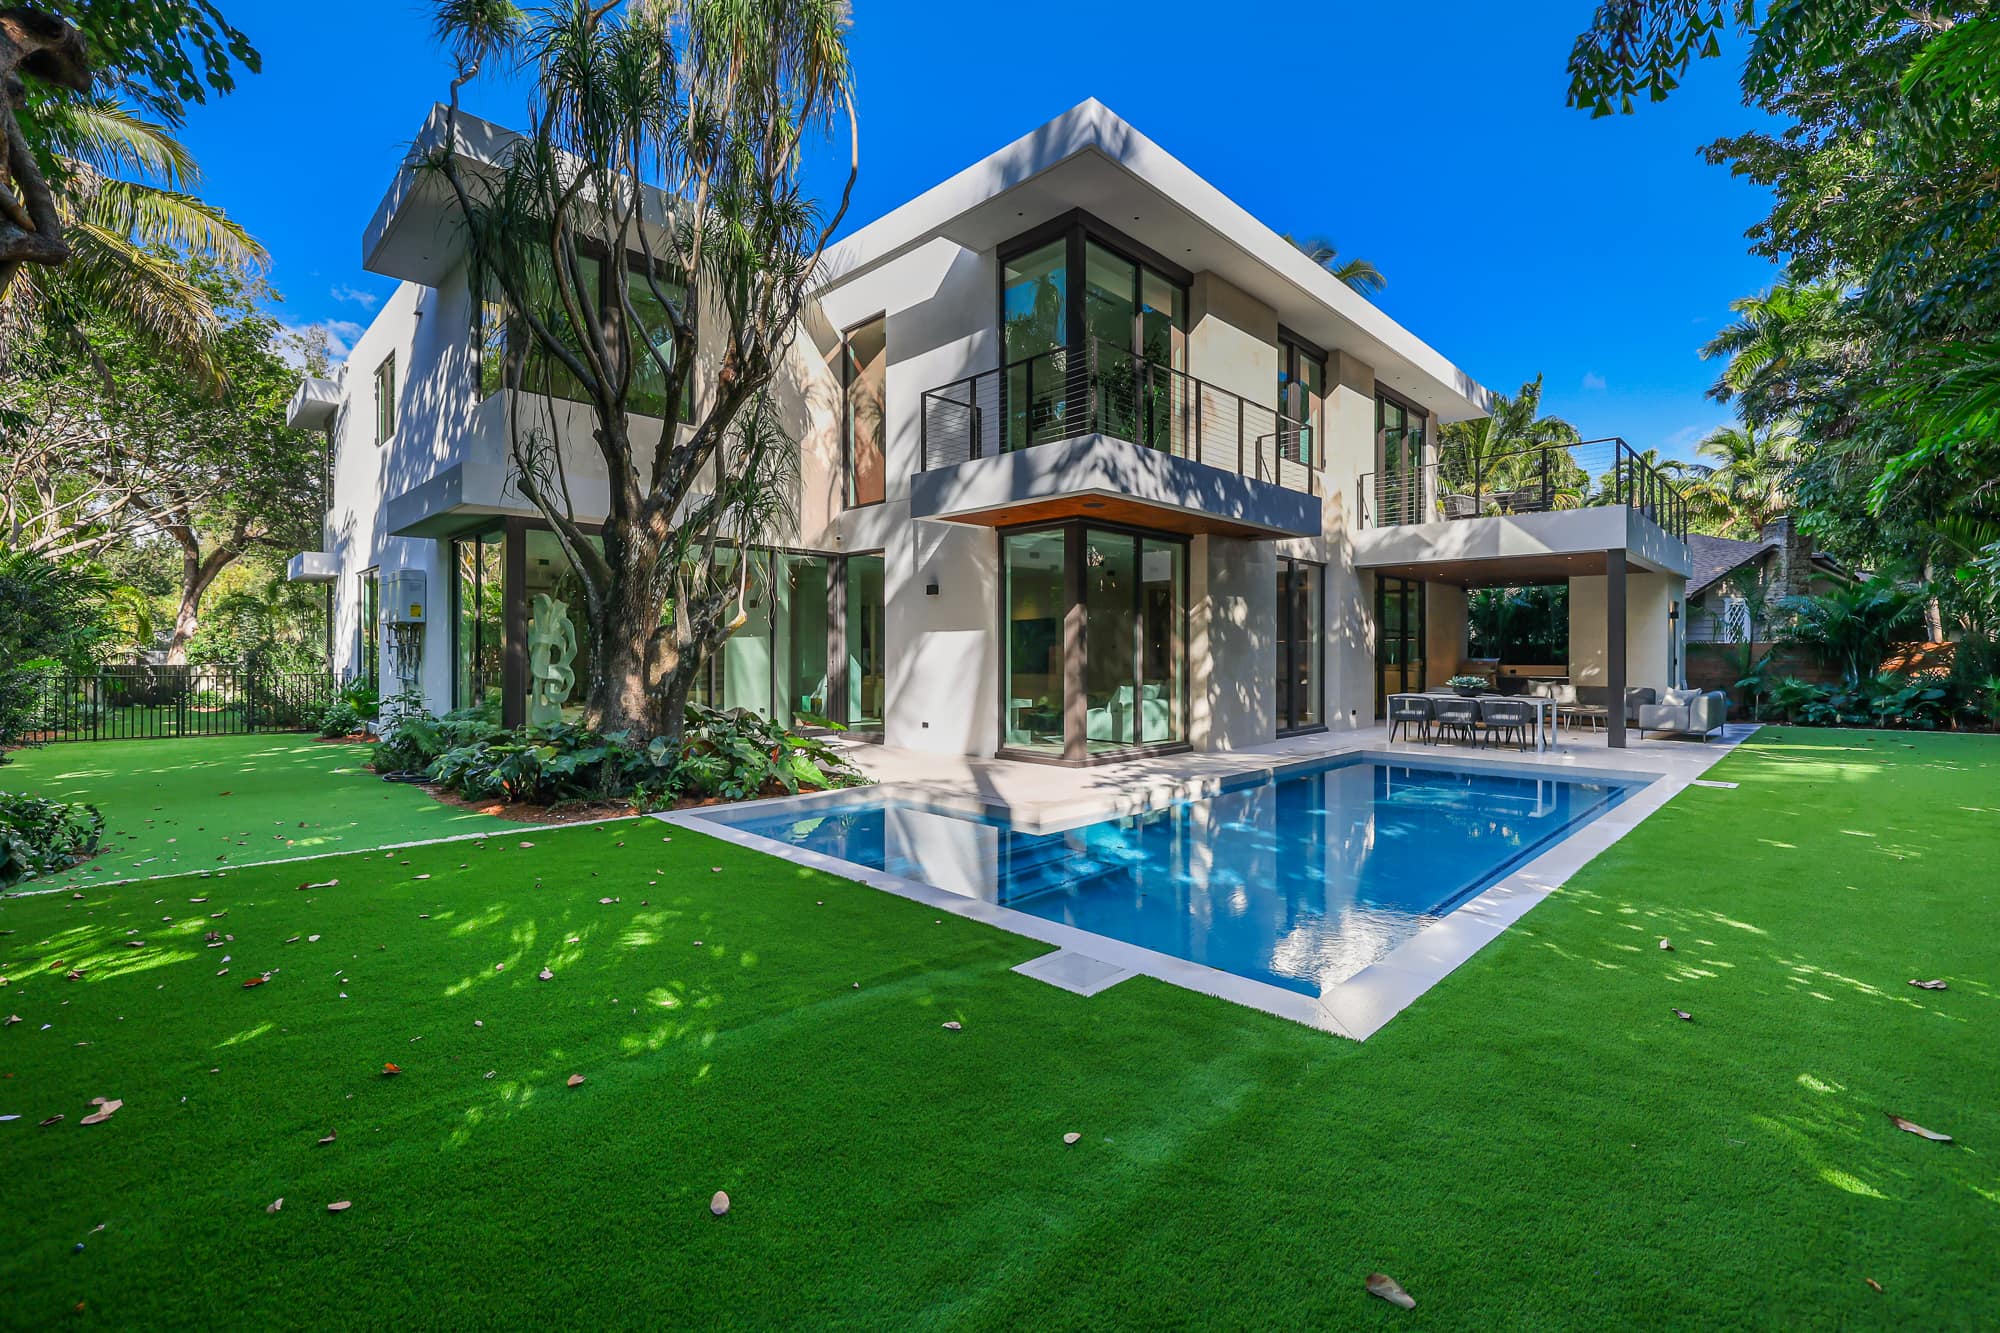
In the twelve months to September 30, 2026, single-family homes in Miami Beach closed at a median of 91.9% of their last list price, after a median of 102 days on the market, from 253 closed sales. Condominiums closed at a median of 94.5%, after 82 days, from 1,614 sales (closed sales the MIAMI REALTORS® MLS reported, read October 12, 2026).
A sale in Miami Beach is read against its own product. A condominium is compared inside its building first, a house on its island or its plat first. A citywide average mixes 43,034 units with 4,834 houses and describes neither.
Those figures are the market's sales, not Julian Acosta's own.
These figures tell a Miami Beach seller where the market's homes landed: houses at a median of 91.9% of their last list price in the twelve months to September 30, 2026, by MIAMI REALTORS® MLS closed sales. They are the market's sales, not Julian Acosta's own.
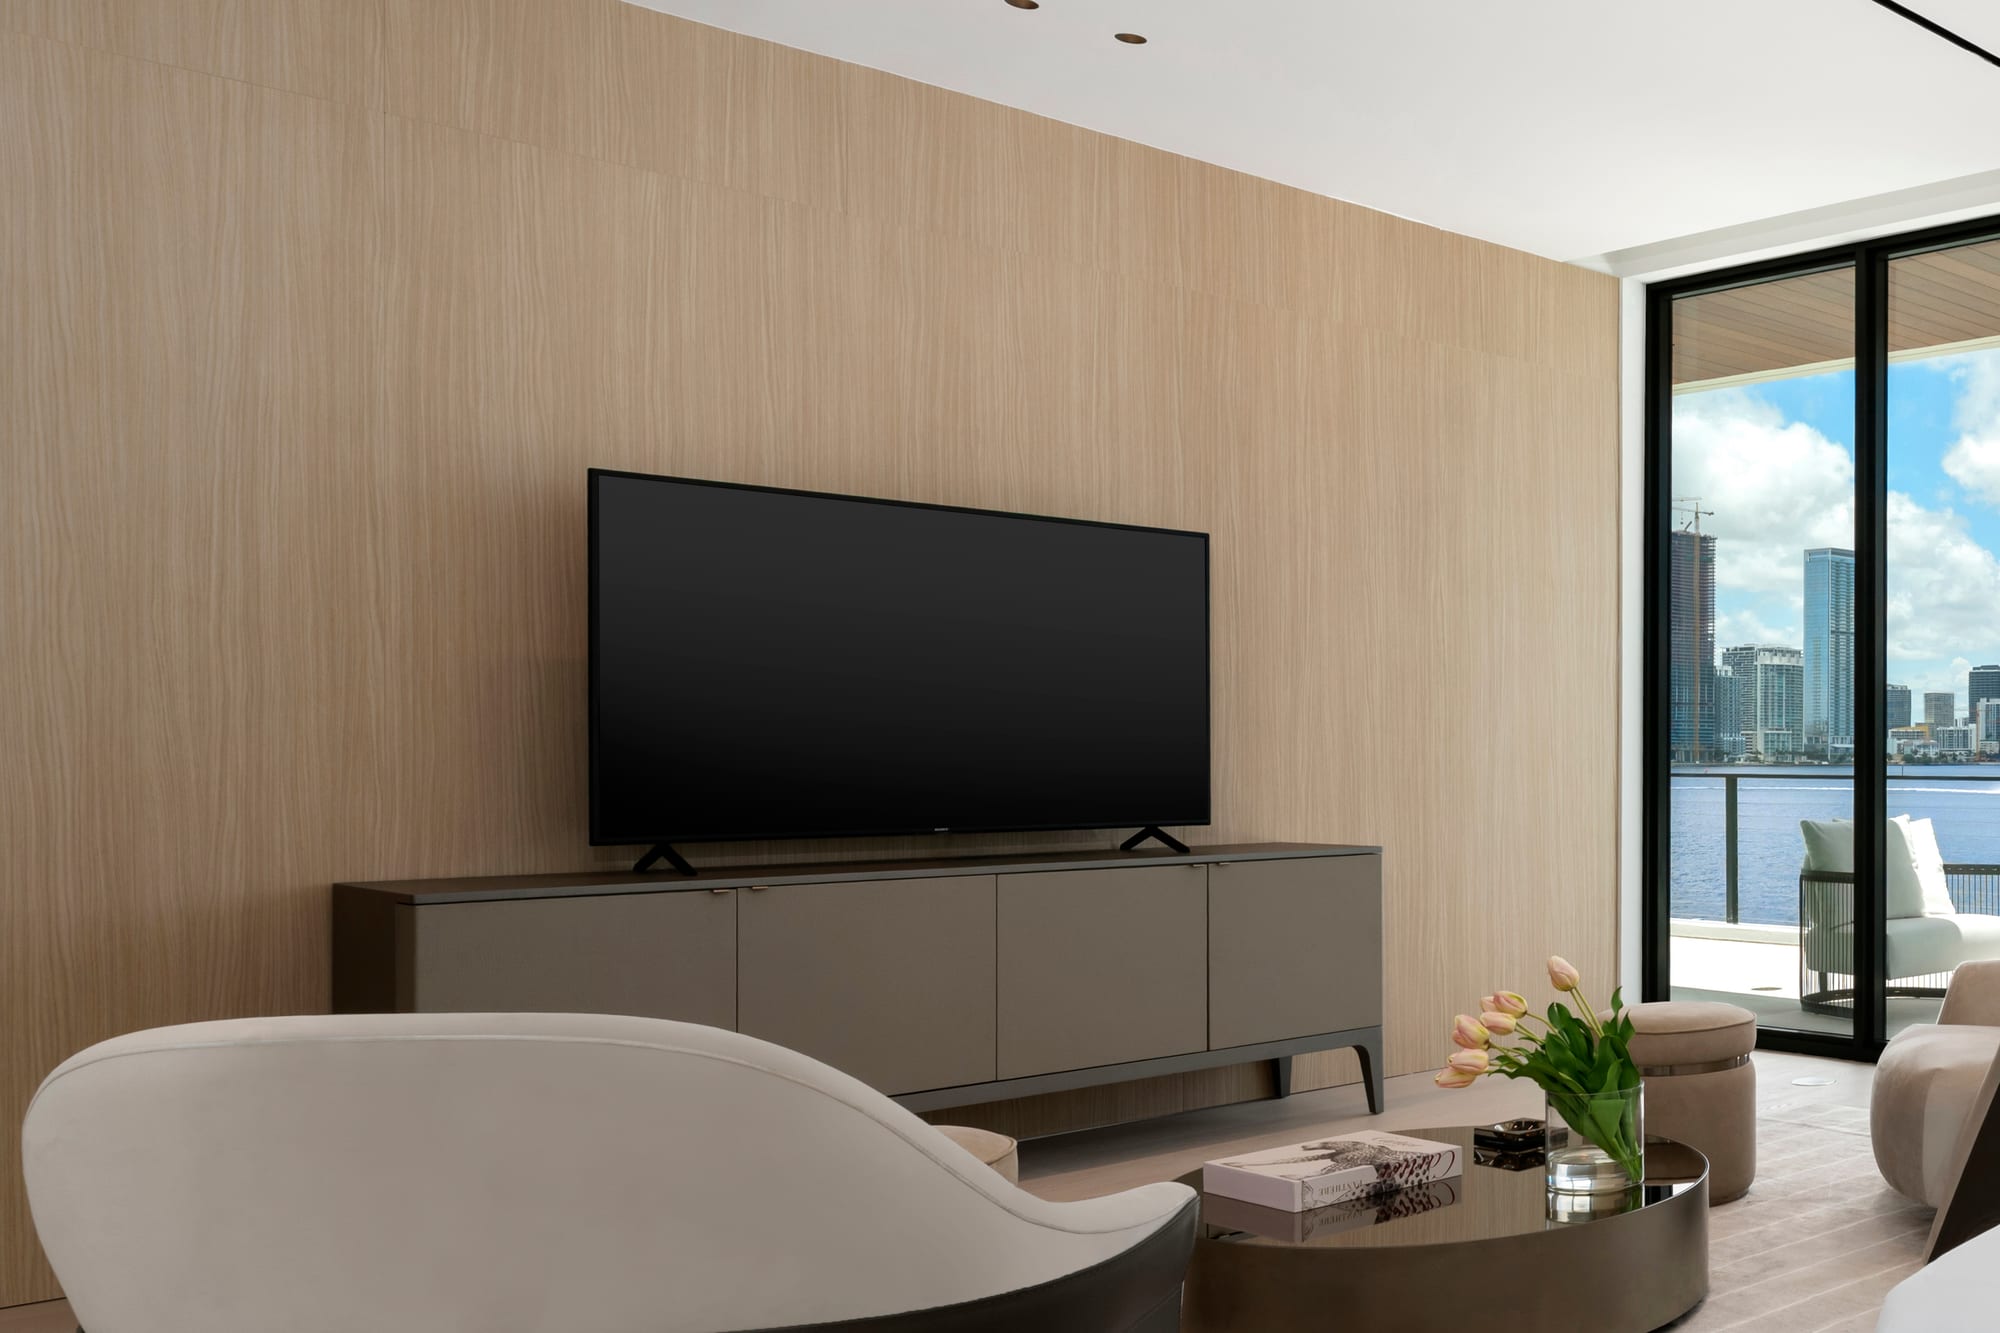
Every review here was written by a client on Julian Acosta's Google Business Profile, and each one links to where it was written.
“Julian is a great partner in your dream house search in Pinecrest. He is commited in making sure you are very happy with your purchase. Best realtor in Pinecrest!”
“I had the opportunity to work with Julian after he shared some valuable insights about the local market, and right from the start, his transparency and dedication stood out. He offered helpful information without any pressure, which built the trust I needed to move forward with selling my property in Miami Beach. Even though the South Florida market has been pretty slow, Julian knew exactly how to position the property. Thanks to his strong network and the groundwork he’d been doing, he was able to get it under contract while it was still off market. I had tried to sell before without success, but this time we were able to close a deal that truly worked in my favor. I really appreciated his follow-through, attention to detail, and the way he navigated the entire process. I’d gladly recommend him”
“We had the pleasure of working with Julian Acosta to sell my husband's apartment in Coconut Grove, and we couldn't be happier with the experience. Julian was always available and incredibly easy to contact, making the entire process smooth and stress-free. His promptness and reliability stood out throughout the sale. Julian demonstrated exceptional knowledge of the market and provided us with invaluable advice on pricing the apartment appropriately. When difficulties arose during the closing process, he worked diligently to facilitate and resolve these issues efficiently. Thanks to his hard work and dedication, the apartment sold rapidly. We greatly appreciate Julian's efforts and professionalism. Without hesitation, we would choose to work with him again in the future and recommend his services to anyone in need of an outstanding realtor.”
“It was a pleasure working with Julian. He was very organized, articulate, and responsive. *Updating original review. Julian has helped us twice now: first as renters, and now as buyers. In both cases Julian was extremely professional, helpful, and a pleasure to work with from start to finish. Highly recommend him as a real estate agent.”
“Julian and his team were stellar - with their strategies and resources, we were able to close on our home quickly and at our asking price! They are so knowledgeable and were very reassuring, kind, and positive throughout the whole process. We have both bought and sold with Julian and his team, and have complete confidence in them! Thank you for everything!”
“I hired Julian to sell a house in Miami . He was friendly and wonderful to work with. He has great negotiation skills and I was impressed with how quickly he sold the home. He kept in contact with me throughout the entire experience. I would definitely hire him again for any real estate needs I have in the future”
71 Google reviews, rated 5.0, read OCT 31, 2026
If that's how you want your sale or your purchase in Miami Beach handled, let's talk.
Schedule a consultation↗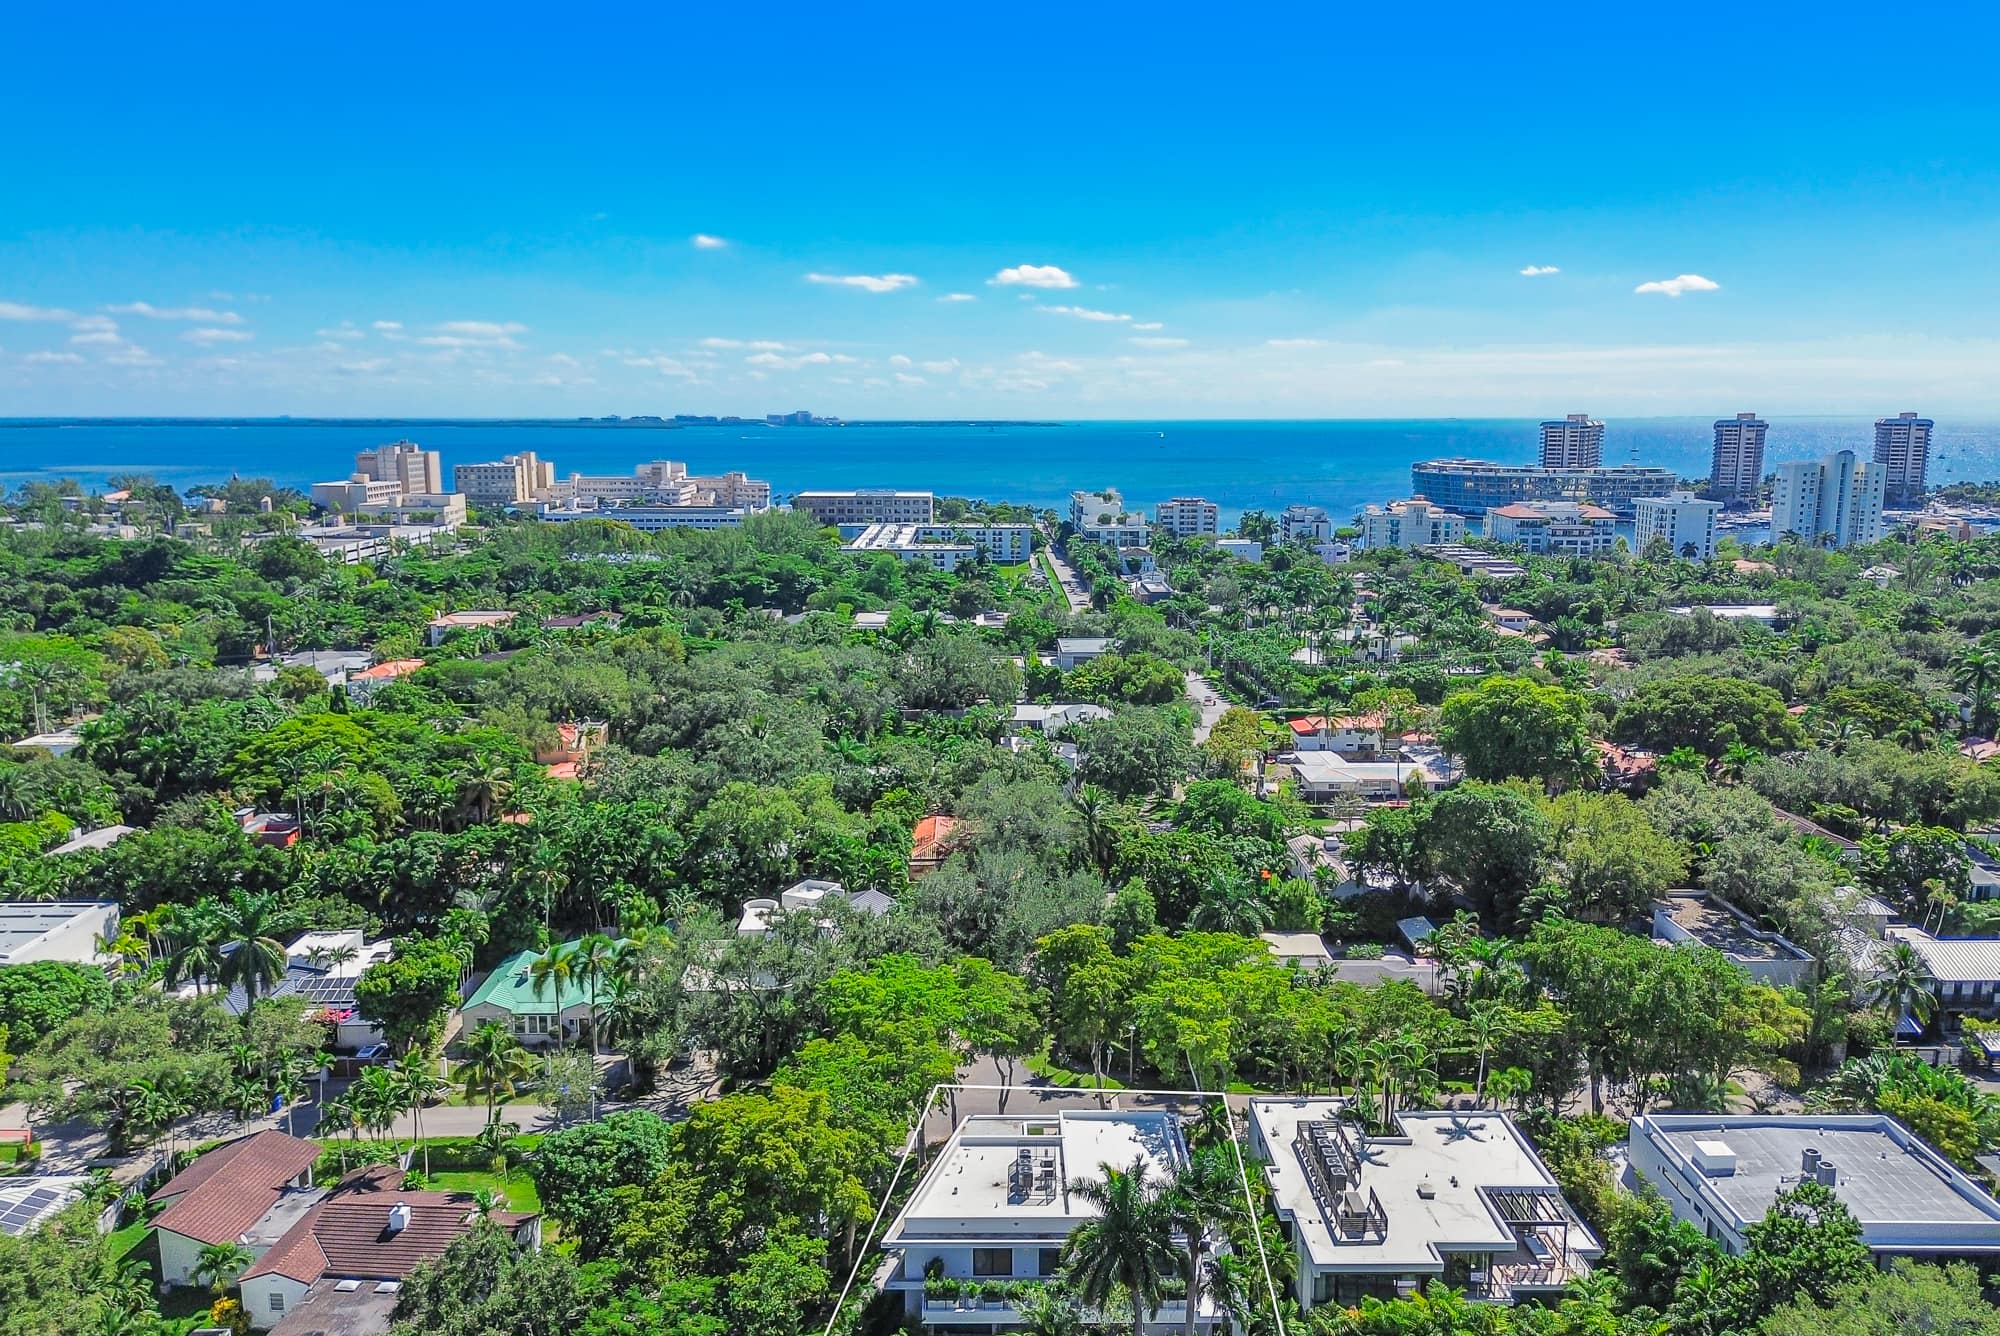
Reported from the County's parcel record, the City's own pages and the MLS.