 1 / 25ACTIVE
$172,500,000
10 beds | 18 baths | 21,145 sqft | 2.18 acres
600-620 Arvida Pkwy, Coral Gables, FL 33156
LISTED BY Mocca Realty, LLC.↗
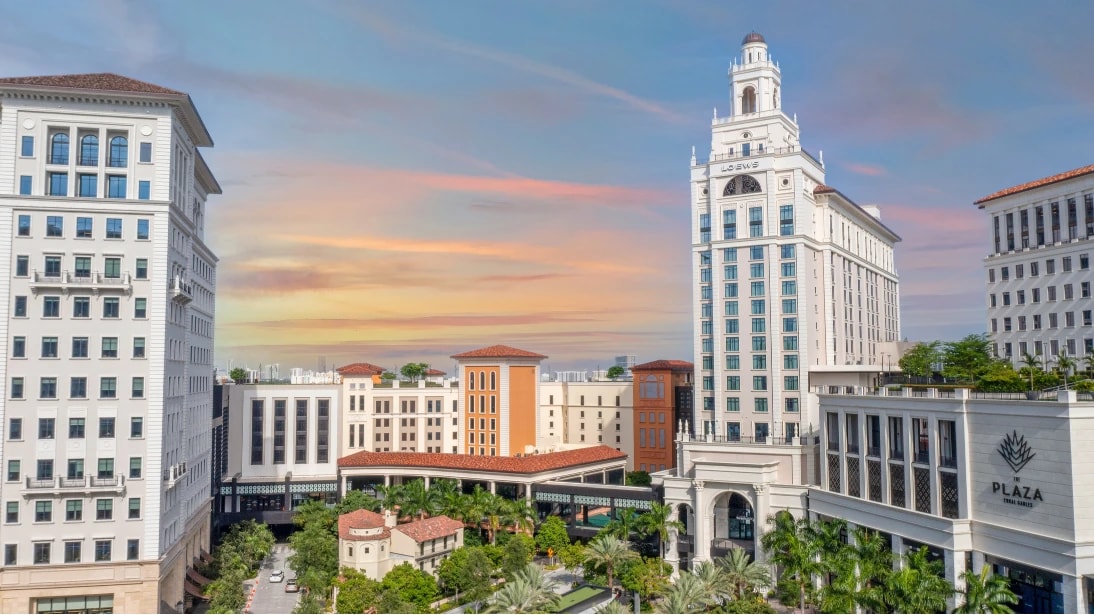
Coral Gables homes, condominiums, fourteen gated communities and the waterfront, read from MLS closed sales and Miami-Dade County public records: the highest recorded sale is $55M, in Gables Estates, reached in June 2025 and again in April 2026.
Coral Gables is a city of its own in Miami-Dade County, southwest of downtown Miami: a city of houses on planned streets. It has fourteen gated communities and homes on Biscayne Bay and its canals. Its highest recorded sale is $55M, in Gables Estates, reached in June 2025 and again in April 2026, according to MLS closed sales and Miami-Dade County public records. Houses outside the gated communities closed at a median of $1,915,000 in the twelve months to September 29, 2026, according to MIAMI REALTORS® MLS closed sales. Julian Acosta, of Compass, operates inside the Coral Gables market full-time.
Coral Gables holds the U.S. neighborhood with the highest typical home value in Zillow's Home Value Index, September 2026: Gables Estates. A $55M off-market sale in June 2025 set the recorded high in Gables Estates, and a second sale matched it in April 2026.
Ten-year appreciation of 121.7% places Coral Gables among the top-ranked cities in NeighborhoodScout's national index. New construction runs from the corridor outside the gates to the gated waterfront, and inventory sits near a balanced market.
Every live figure in this Coral Gables glance is read from the MIAMI REALTORS® MLS, stamped with the date of its read and written out as text so it can be cited.
This glance tells you where the Coral Gables market stands today: what is for sale and at what asking price, read live from the MIAMI REALTORS® MLS. Beside it stand two documented figures that frame it: the $55M recorded high in Gables Estates, and Coral Gables' 121.7% ten-year appreciation in NeighborhoodScout's index. It does not value a single home.
| Read | Value | Note |
|---|---|---|
| Median $/SF (all types) | $825–$875 | |
| New construction $/SF — historic neighborhoods | $1,043–$1,363 | |
| New construction $/SF — gated waterfront | $2,000–$5,863 | Old Cutler Bay record |
| Gables Estates record sale | $55M | JUN 2025 · matched APR 2026 |
| Old Cutler Bay record $/SF | $5,863 | 625 Reinante Ave · $47M · 2026 |
| 10-year appreciation | 121.7% |
These Coral Gables reads, from a new house's $1,043–$1,363 per square foot in the historic neighborhoods to the record sale, by Julian Acosta's read of the second quarter of 2026, place a Coral Gables price against its own market and against Coconut Grove and Pinecrest; a single property's value is its own.
Real local data by micromarket: Coral Gables' closed sales in its four areas, north and east of US-1, next to Coconut Grove and in the gated communities, each by type of home and by the water, over the twelve months to September 30, 2026.
Choose a micromarket on the map or here to go to its figures, below.
Prices by area and neighborhood: Coral Gables house medians ran from $1,237,500 in the Coconut Grove Section to $16,000,000 in Old Cutler Bay over the 12 months to September 2026.
A neighborhood's median is its typical price: half its houses sold for more and half for less. In Coral Gables, the place moves the price more than the year does.
Waterfront and dry: A Coral Gables house on the water sold for a median of $8,050,000 over the 12 months to September 2026; off the water, $1,950,000.
On the water, houses in the same city trade in another price range.
Median sale price · single-family
$1,780,000
A year earlier: $1,750,000 · ▲ 1.7%
If you own a house in Coral Gables north of US-1, this is your yardstick: half of the 236 houses sold there in the 12 months to September 30, 2026 closed above $1,780,000 and half below, against $2,200,000 across Coral Gables (MIAMI REALTORS® MLS).
12 months · 236 sales · MIAMI REALTORS® MLS
Closed sales
236
A year earlier: 200
236 houses sold in Coral Gables north of US-1 in the 12 months to September 30, 2026, about 20 a month, against 200 the 12 months before (MIAMI REALTORS® MLS).
12 months · 236 sales · MIAMI REALTORS® MLS
Median price per sq ft · single-family
$896
A year earlier: $857 · ▲ 4.6%
To compare homes of different sizes, look at the price per square foot: a house in Coral Gables north of US-1 sold for a median $896 in the 12 months to September 30, 2026, so 2,000 Sq.Ft at that rate comes to about $1,790,000 (MIAMI REALTORS® MLS).
12 months · 236 sales · MIAMI REALTORS® MLS
Median days on market · single-family
42 days
A year earlier: 43 days
If you sell a house in Coral Gables north of US-1, plan for about 6 weeks: the typical one took 42 days to sell in the 12 months to September 30, 2026 (MIAMI REALTORS® MLS).
12 months · 236 sales · MIAMI REALTORS® MLS
Median sale price · condominiums
$550,000
A year earlier: $577,500 · ▼ 4.8%
If you own a condominium in Coral Gables north of US-1, this is your yardstick: half of the 158 condominiums sold there in the 12 months to September 30, 2026 closed above $550,000 and half below, against $540,000 across Coral Gables (MIAMI REALTORS® MLS).
12 months · 158 sales · MIAMI REALTORS® MLS
Closed sales
158
A year earlier: 165
158 condominiums sold in Coral Gables north of US-1 in the 12 months to September 30, 2026, about 13 a month, against 165 the 12 months before (MIAMI REALTORS® MLS).
12 months · 158 sales · MIAMI REALTORS® MLS
Median price per sq ft · condominiums
$540
A year earlier: $560 · ▼ 3.6%
To compare homes of different sizes, look at the price per square foot: a condominium in Coral Gables north of US-1 sold for a median $540 in the 12 months to September 30, 2026, so 1,000 Sq.Ft at that rate comes to about $540,000 (MIAMI REALTORS® MLS).
12 months · 158 sales · MIAMI REALTORS® MLS
Median days on market · condominiums
71.5 days
A year earlier: 55 days
If you sell a condominium in Coral Gables north of US-1, plan for about 10 weeks: the typical one took 71.5 days to sell in the 12 months to September 30, 2026 (MIAMI REALTORS® MLS).
12 months · 158 sales · MIAMI REALTORS® MLS
Median sale price · townhouses
$1,400,000
A year earlier: 13 sales at $2,400,000
If you own a townhouse in Coral Gables north of US-1, this is your yardstick: half of the 19 townhouses sold there in the 12 months to September 30, 2026 closed above $1,400,000 and half below, against $1,400,000 across Coral Gables (MIAMI REALTORS® MLS).
12 months · 19 sales · MIAMI REALTORS® MLS
Closed sales
19
A year earlier: 13
19 townhouses sold in Coral Gables north of US-1 in the 12 months to September 30, 2026, about 2 a month, against 13 the 12 months before (MIAMI REALTORS® MLS).
12 months · 19 sales · MIAMI REALTORS® MLS
Median price per sq ft · townhouses
$722
A year earlier: $806
To compare homes of different sizes, look at the price per square foot: a townhouse in Coral Gables north of US-1 sold for a median $722 in the 12 months to September 30, 2026, so 2,000 Sq.Ft at that rate comes to about $1,440,000 (MIAMI REALTORS® MLS).
12 months · 19 sales · MIAMI REALTORS® MLS
Median days on market · townhouses
117 days
A year earlier: 62 days
If you sell a townhouse in Coral Gables north of US-1, plan for about 17 weeks: the typical one took 117 days to sell in the 12 months to September 30, 2026 (MIAMI REALTORS® MLS).
12 months · 19 sales · MIAMI REALTORS® MLS
On the water, 10 houses sold at a median of $3,925,000; off it, 226 at $1,718,750.
None of the 158 condominiums was in a building on the water.
None of the 19 townhouses was on the water.
Full report for Coral Gables north of US-1 →Median sale price · single-family
$7,065,750
A year earlier: $5,800,000 · ▲ 21.8%
If you own a house in Coral Gables’ gated communities, this is your yardstick: half of the 72 houses sold there in the 12 months to September 30, 2026 closed above $7,065,750 and half below, against $2,200,000 across Coral Gables (MIAMI REALTORS® MLS).
12 months · 72 sales · MIAMI REALTORS® MLS
Closed sales
72
A year earlier: 55
72 houses sold in Coral Gables’ gated communities in the 12 months to September 30, 2026, about 6 a month, against 55 the 12 months before (MIAMI REALTORS® MLS).
12 months · 72 sales · MIAMI REALTORS® MLS
Median price per sq ft · single-family
$1,563
A year earlier: $1,342 · ▲ 16.5%
To compare homes of different sizes, look at the price per square foot: a house in Coral Gables’ gated communities sold for a median $1,563 in the 12 months to September 30, 2026, so 2,000 Sq.Ft at that rate comes to about $3,130,000 (MIAMI REALTORS® MLS).
12 months · 72 sales · MIAMI REALTORS® MLS
Median days on market · single-family
84.5 days
A year earlier: 63 days
If you sell a house in Coral Gables’ gated communities, plan for about 12 weeks: the typical one took 84.5 days to sell in the 12 months to September 30, 2026 (MIAMI REALTORS® MLS).
12 months · 72 sales · MIAMI REALTORS® MLS
Condos · none sold
Townhouses · none sold
On the water, 41 houses sold at a median of $10,250,000; off it, 31 at $5,600,000.
Full report for Coral Gables’ gated communities →Median sale price · single-family
$2,600,000
A year earlier: $2,550,000 · ▲ 2.0%
If you own a house in Coral Gables east of US-1, this is your yardstick: half of the 57 houses sold there in the 12 months to September 30, 2026 closed above $2,600,000 and half below, against $2,200,000 across Coral Gables (MIAMI REALTORS® MLS).
12 months · 57 sales · MIAMI REALTORS® MLS
Closed sales
57
A year earlier: 74
57 houses sold in Coral Gables east of US-1 in the 12 months to September 30, 2026, about 5 a month, against 74 the 12 months before (MIAMI REALTORS® MLS).
12 months · 57 sales · MIAMI REALTORS® MLS
Median price per sq ft · single-family
$1,026
A year earlier: $983 · ▲ 4.4%
To compare homes of different sizes, look at the price per square foot: a house in Coral Gables east of US-1 sold for a median $1,026 in the 12 months to September 30, 2026, so 2,000 Sq.Ft at that rate comes to about $2,050,000 (MIAMI REALTORS® MLS).
12 months · 57 sales · MIAMI REALTORS® MLS
Median days on market · single-family
36 days
A year earlier: 49.5 days
If you sell a house in Coral Gables east of US-1, plan for about 5 weeks: the typical one took 36 days to sell in the 12 months to September 30, 2026 (MIAMI REALTORS® MLS).
12 months · 57 sales · MIAMI REALTORS® MLS
Median sale price · condominiums
$460,000
A year earlier: $455,000 · ▲ 1.1%
If you own a condominium in Coral Gables east of US-1, this is your yardstick: half of the 65 condominiums sold there in the 12 months to September 30, 2026 closed above $460,000 and half below, against $540,000 across Coral Gables (MIAMI REALTORS® MLS).
12 months · 65 sales · MIAMI REALTORS® MLS
Closed sales
65
A year earlier: 69
65 condominiums sold in Coral Gables east of US-1 in the 12 months to September 30, 2026, about 5 a month, against 69 the 12 months before (MIAMI REALTORS® MLS).
12 months · 65 sales · MIAMI REALTORS® MLS
Median price per sq ft · condominiums
$478
A year earlier: $501 · ▼ 4.6%
To compare homes of different sizes, look at the price per square foot: a condominium in Coral Gables east of US-1 sold for a median $478 in the 12 months to September 30, 2026, so 1,000 Sq.Ft at that rate comes to about $480,000 (MIAMI REALTORS® MLS).
12 months · 65 sales · MIAMI REALTORS® MLS
Median days on market · condominiums
60 days
A year earlier: 51 days
If you sell a condominium in Coral Gables east of US-1, plan for about 8½ weeks: the typical one took 60 days to sell in the 12 months to September 30, 2026 (MIAMI REALTORS® MLS).
12 months · 65 sales · MIAMI REALTORS® MLS
Townhouses · none sold
On the water, 2 houses sold; off it, 55.
In a building on the water, 30 condominiums sold at a median of $657,500; off it, 35 at $398,000.
Full report for Coral Gables east of US-1 →Median sale price · single-family
$1,237,500
A year earlier: $1,350,000 · ▼ 8.3%
If you own a house in Coral Gables next to Coconut Grove, this is your yardstick: half of the 24 houses sold there in the 12 months to September 30, 2026 closed above $1,237,500 and half below, against $2,200,000 across Coral Gables (MIAMI REALTORS® MLS).
12 months · 24 sales · MIAMI REALTORS® MLS
Closed sales
24
A year earlier: 25
24 houses sold in Coral Gables next to Coconut Grove in the 12 months to September 30, 2026, about 2 a month, against 25 the 12 months before (MIAMI REALTORS® MLS).
12 months · 24 sales · MIAMI REALTORS® MLS
Median price per sq ft · single-family
$870
A year earlier: $772 · ▲ 12.7%
To compare homes of different sizes, look at the price per square foot: a house in Coral Gables next to Coconut Grove sold for a median $870 in the 12 months to September 30, 2026, so 2,000 Sq.Ft at that rate comes to about $1,740,000 (MIAMI REALTORS® MLS).
12 months · 24 sales · MIAMI REALTORS® MLS
Median days on market · single-family
40 days
A year earlier: 28 days
If you sell a house in Coral Gables next to Coconut Grove, plan for about 5½ weeks: the typical one took 40 days to sell in the 12 months to September 30, 2026 (MIAMI REALTORS® MLS).
12 months · 24 sales · MIAMI REALTORS® MLS
Condos · none sold
Townhouses · none sold
None of the 24 houses was on the water.
Full report for Coral Gables next to Coconut Grove →| Neighborhood | Closed sales | Median sale price | Price per square foot | Median vs a year earlier | Median days |
|---|---|---|---|---|---|
| North of US-1 | 236 | $1,780,000 | $896 | ▲ 1.7% | 42 |
| Lettered Sections | 63 | $2,025,000 | $893 | ▲ 14.1% | 42 |
| Country Club Section | 52 | $1,957,500 | $926 | ▼ 12.0% | 42.5 |
| Granada | 48 | $1,370,000 | $818 | ▲ 2.6% | 41.5 |
| Biltmore | 7 | $2,134,600 | $1,046 | — | 43 |
| Riviera | 34 | $2,225,000 | $962 | ▲ 20.3% | 23 |
Gables Waterway / Sans SouciEach sale (1)
| 1 | — | — | — | — |
| Elsewhere North of US-1 | 31 | $1,300,000 | $776 | ▼ 10.5% | 72 |
| East of US-1 | 57 | $2,600,000 | $1,026 | ▲ 2.0% | 36 |
| Riviera | 37 | $2,280,000 | $1,026 | ▼ 8.8% | 46 |
| Biscayne Bay Section | 7 | $2,900,000 | $1,281 | — | 33 |
| Gables Waterway / Sans Souci | 5 | $3,450,000 | $998 | — | 78 |
| Elsewhere East of US-1 | 8 | $3,127,324 | $972 | — | 17 |
| Next to Coconut Grove | 24 | $1,237,500 | $870 | ▼ 8.3% | 40 |
| Coconut Grove Section | 16 | $1,237,500 | $745 | ▼ 8.3% | 23.5 |
Morningside / SunriseEach sale (4)
| 4 | $2,385,00024 months | $942 | — | 16 |
MacFarlane HomesteadEach sale (4)
| 4 | $680,00024 months | $520 | — | 38 |
| The gated communities | 72 | $7,065,750 | $1,563 | ▲ 21.8% | 84.5 |
| Cocoplum | 14 | $8,485,000 | $1,503 | — | 98.5 |
Gables EstatesEach sale (3)
| 3 | $26,202,68924 months | $2,637 | — | 73 |
Tahiti BeachEach sale (2)
| 2 | — | — | — | — |
| Old Cutler Bay | 9 | $16,000,000 | $2,564 | — | 126 |
| Gables by the Sea | 15 | $3,400,000 | $1,125 | — | 74 |
| Snapper Creek | 6 | $10,015,000 | $1,730 | — | 79 |
Hammock LakesEach sale (4)
| 4 | $8,000,00024 months | $1,657 | — | 101 |
| Banyan Lakes | 6 | $7,390,750 | $1,010 | — | 203.5 |
| Sunrise Harbour | 5 | $13,000,000 | $2,945 | — | 72 |
Kings BayEach sale (4)
| 4 | $1,687,00024 months | $712 | — | 81 |
| Journey's End | 0 | — | — | — | — |
Deering BayEach sale (3)
| 3 | — | — | — | — |
Hammock Oaks HarborEach sale (1)
| 1 | $4,167,82024 months | $981 | — | 49 |
| Neighborhood | Closed sales | Median sale price | Price per square foot | Median vs a year earlier | Median days |
|---|---|---|---|---|---|
| North of US-1 | 10 | $3,925,000 | $1,186 | — | 39.5 |
| Lettered Sections | 0 | — | — | — | — |
| Country Club Section | 2 | — | — | — | — |
| Granada | 0 | — | — | — | — |
| Biltmore | 0 | — | — | — | — |
| Riviera | 7 | $3,750,000 | $1,344 | — | 7 |
Gables Waterway / Sans SouciEach sale (1)
| 1 | — | — | — | — |
| Elsewhere North of US-1 | 0 | — | — | — | — |
| East of US-1 | 2 | $4,875,00024 months | $1,482 | — | 73 |
| Riviera | 2 | $4,775,00024 months | $1,330 | — | 71.5 |
| Biscayne Bay Section | 0 | — | — | — | — |
| Gables Waterway / Sans Souci | 0 | — | — | — | — |
| Elsewhere East of US-1 | 0 | — | — | — | — |
| Next to Coconut Grove | 0 | — | — | — | — |
| Coconut Grove Section | 0 | — | — | — | — |
| Morningside / Sunrise | 0 | — | — | — | — |
| MacFarlane Homestead | 0 | — | — | — | — |
| The gated communities | 41 | $10,250,000 | $1,908 | ▲ 51.3% | 103 |
| Cocoplum | 6 | $10,375,000 | $1,693 | — | 109.5 |
Gables EstatesEach sale (3)
| 3 | $26,202,68924 months | $2,637 | — | 73 |
Tahiti BeachEach sale (1)
| 1 | — | — | — | — |
| Old Cutler Bay | 8 | $16,975,000 | $2,796 | — | 144 |
| Gables by the Sea | 12 | $4,600,539 | $1,312 | — | 88.5 |
| Snapper Creek | 2 | — | — | — | — |
Hammock LakesEach sale (1)
| 1 | — | — | — | — |
| Banyan Lakes | 2 | — | — | — | — |
| Sunrise Harbour | 5 | $13,000,000 | $2,945 | — | 72 |
| Kings Bay | 0 | — | — | — | — |
| Journey's End | 0 | — | — | — | — |
| Deering Bay | 0 | — | — | — | — |
Hammock Oaks HarborEach sale (1)
| 1 | $4,250,00024 months | $897 | — | 105 |
| Neighborhood | Closed sales | Median sale price | Price per square foot | Median vs a year earlier | Median days |
|---|---|---|---|---|---|
| North of US-1 | 226 | $1,718,750 | $889 | ▼ 0.4% | 42 |
| Lettered Sections | 63 | $2,025,000 | $893 | ▲ 14.1% | 42 |
| Country Club Section | 50 | $1,913,750 | $916 | ▼ 14.0% | 42.5 |
| Granada | 48 | $1,370,000 | $818 | ▲ 2.6% | 41.5 |
| Biltmore | 7 | $2,134,600 | $1,046 | — | 43 |
| Riviera | 27 | $1,845,000 | $956 | ▲ 0.7% | 24 |
| Gables Waterway / Sans Souci | 0 | — | — | — | — |
| Elsewhere North of US-1 | 31 | $1,300,000 | $776 | ▼ 10.5% | 72 |
| East of US-1 | 55 | $2,550,000 | $1,020 | ▲ 1.0% | 36 |
| Riviera | 35 | $2,200,000 | $1,020 | ▼ 6.4% | 46 |
| Biscayne Bay Section | 7 | $2,900,000 | $1,281 | — | 33 |
| Gables Waterway / Sans Souci | 5 | $3,450,000 | $998 | — | 78 |
| Elsewhere East of US-1 | 8 | $3,127,324 | $972 | — | 17 |
| Next to Coconut Grove | 24 | $1,237,500 | $870 | ▼ 8.3% | 40 |
| Coconut Grove Section | 16 | $1,237,500 | $745 | ▼ 8.3% | 23.5 |
Morningside / SunriseEach sale (4)
| 4 | $2,385,00024 months | $942 | — | 16 |
MacFarlane HomesteadEach sale (4)
| 4 | $680,00024 months | $520 | — | 38 |
| The gated communities | 31 | $5,600,000 | $1,150 | ▲ 6.7% | 36 |
| Cocoplum | 8 | $6,150,000 | $1,345 | — | 32.5 |
| Gables Estates | 0 | — | — | — | — |
Tahiti BeachEach sale (1)
| 1 | — | — | — | — |
| Old Cutler Bay | 1 | — | — | — | — |
| Gables by the Sea | 3 | — | — | — | — |
| Snapper Creek | 4 | $6,000,00024 months | $1,692 | — | 46 |
Hammock LakesEach sale (3)
| 3 | $9,875,00024 months | $1,656 | — | 110.5 |
| Banyan Lakes | 4 | $7,500,00024 months | $896 | — | 196 |
| Sunrise Harbour | 0 | — | — | — | — |
Kings BayEach sale (4)
| 4 | $1,581,00024 months | $696 | — | 57.5 |
| Journey's End | 0 | — | — | — | — |
Deering BayEach sale (3)
| 3 | — | — | — | — |
| Hammock Oaks Harbor | 0 | — | — | — | — |
| Neighborhood | Closed sales | Median sale price | Price per square foot | Median vs a year earlier | Median days |
|---|---|---|---|---|---|
| North of US-1 | 158 | $550,000 | $540 | ▼ 4.8% | 71.5 |
| Lettered Sections | 0 | — | — | — | — |
| Country Club Section | 0 | — | — | — | — |
| Granada | 0 | — | — | — | — |
| Biltmore | 0 | — | — | — | — |
| Riviera | 0 | — | — | — | — |
| Gables Waterway / Sans Souci | 0 | — | — | — | — |
| Elsewhere North of US-1 | 158 | $550,000 | $540 | ▼ 4.8% | 71.5 |
| East of US-1 | 65 | $460,000 | $478 | ▲ 1.1% | 60 |
| Riviera | 0 | — | — | — | — |
| Biscayne Bay Section | 0 | — | — | — | — |
| Gables Waterway / Sans Souci | 0 | — | — | — | — |
| Elsewhere East of US-1 | 65 | $460,000 | $478 | ▲ 1.1% | 60 |
| Next to Coconut Grove | 0 | — | — | — | — |
| Coconut Grove Section | 0 | — | — | — | — |
| Morningside / Sunrise | 0 | — | — | — | — |
| MacFarlane Homestead | 0 | — | — | — | — |
| The gated communities | 0 | — | — | — | — |
| Cocoplum | 0 | — | — | — | — |
| Gables Estates | 0 | — | — | — | — |
| Tahiti Beach | 0 | — | — | — | — |
| Old Cutler Bay | 0 | — | — | — | — |
| Gables by the Sea | 0 | — | — | — | — |
| Snapper Creek | 0 | — | — | — | — |
| Hammock Lakes | 0 | — | — | — | — |
| Banyan Lakes | 0 | — | — | — | — |
| Sunrise Harbour | 0 | — | — | — | — |
| Kings Bay | 0 | — | — | — | — |
| Journey's End | 0 | — | — | — | — |
| Deering Bay | 0 | — | — | — | — |
| Hammock Oaks Harbor | 0 | — | — | — | — |
| Neighborhood | Closed sales | Median sale price | Price per square foot | Median vs a year earlier | Median days |
|---|---|---|---|---|---|
| North of US-1 | 0 | — | — | — | — |
| Lettered Sections | 0 | — | — | — | — |
| Country Club Section | 0 | — | — | — | — |
| Granada | 0 | — | — | — | — |
| Biltmore | 0 | — | — | — | — |
| Riviera | 0 | — | — | — | — |
| Gables Waterway / Sans Souci | 0 | — | — | — | — |
| Elsewhere North of US-1 | 0 | — | — | — | — |
| East of US-1 | 30 | $657,500 | $542 | ▼ 12.3% | 73 |
| Riviera | 0 | — | — | — | — |
| Biscayne Bay Section | 0 | — | — | — | — |
| Gables Waterway / Sans Souci | 0 | — | — | — | — |
| Elsewhere East of US-1 | 30 | $657,500 | $542 | ▼ 12.3% | 73 |
| Next to Coconut Grove | 0 | — | — | — | — |
| Coconut Grove Section | 0 | — | — | — | — |
| Morningside / Sunrise | 0 | — | — | — | — |
| MacFarlane Homestead | 0 | — | — | — | — |
| The gated communities | 0 | — | — | — | — |
| Cocoplum | 0 | — | — | — | — |
| Gables Estates | 0 | — | — | — | — |
| Tahiti Beach | 0 | — | — | — | — |
| Old Cutler Bay | 0 | — | — | — | — |
| Gables by the Sea | 0 | — | — | — | — |
| Snapper Creek | 0 | — | — | — | — |
| Hammock Lakes | 0 | — | — | — | — |
| Banyan Lakes | 0 | — | — | — | — |
| Sunrise Harbour | 0 | — | — | — | — |
| Kings Bay | 0 | — | — | — | — |
| Journey's End | 0 | — | — | — | — |
| Deering Bay | 0 | — | — | — | — |
| Hammock Oaks Harbor | 0 | — | — | — | — |
| Neighborhood | Closed sales | Median sale price | Price per square foot | Median vs a year earlier | Median days |
|---|---|---|---|---|---|
| North of US-1 | 158 | $550,000 | $540 | ▼ 5.0% | 71.5 |
| Lettered Sections | 0 | — | — | — | — |
| Country Club Section | 0 | — | — | — | — |
| Granada | 0 | — | — | — | — |
| Biltmore | 0 | — | — | — | — |
| Riviera | 0 | — | — | — | — |
| Gables Waterway / Sans Souci | 0 | — | — | — | — |
| Elsewhere North of US-1 | 158 | $550,000 | $540 | ▼ 5.0% | 71.5 |
| East of US-1 | 35 | $398,000 | $390 | ▲ 11.1% | 59 |
| Riviera | 0 | — | — | — | — |
| Biscayne Bay Section | 0 | — | — | — | — |
| Gables Waterway / Sans Souci | 0 | — | — | — | — |
| Elsewhere East of US-1 | 35 | $398,000 | $390 | ▲ 11.1% | 59 |
| Next to Coconut Grove | 0 | — | — | — | — |
| Coconut Grove Section | 0 | — | — | — | — |
| Morningside / Sunrise | 0 | — | — | — | — |
| MacFarlane Homestead | 0 | — | — | — | — |
| The gated communities | 0 | — | — | — | — |
| Cocoplum | 0 | — | — | — | — |
| Gables Estates | 0 | — | — | — | — |
| Tahiti Beach | 0 | — | — | — | — |
| Old Cutler Bay | 0 | — | — | — | — |
| Gables by the Sea | 0 | — | — | — | — |
| Snapper Creek | 0 | — | — | — | — |
| Hammock Lakes | 0 | — | — | — | — |
| Banyan Lakes | 0 | — | — | — | — |
| Sunrise Harbour | 0 | — | — | — | — |
| Kings Bay | 0 | — | — | — | — |
| Journey's End | 0 | — | — | — | — |
| Deering Bay | 0 | — | — | — | — |
| Hammock Oaks Harbor | 0 | — | — | — | — |
| Neighborhood | Closed sales | Median sale price | Price per square foot | Median vs a year earlier | Median days |
|---|---|---|---|---|---|
| North of US-1 | 19 | $1,400,000 | $722 | — | 117 |
| Lettered Sections | 0 | — | — | — | — |
| Country Club Section | 0 | — | — | — | — |
| Granada | 0 | — | — | — | — |
| Biltmore | 0 | — | — | — | — |
| Riviera | 0 | — | — | — | — |
| Gables Waterway / Sans Souci | 0 | — | — | — | — |
| Elsewhere North of US-1 | 19 | $1,400,000 | $722 | — | 117 |
| East of US-1 | 0 | — | — | — | — |
| Riviera | 0 | — | — | — | — |
| Biscayne Bay Section | 0 | — | — | — | — |
| Gables Waterway / Sans Souci | 0 | — | — | — | — |
| Elsewhere East of US-1 | 0 | — | — | — | — |
| Next to Coconut Grove | 0 | — | — | — | — |
| Coconut Grove Section | 0 | — | — | — | — |
| Morningside / Sunrise | 0 | — | — | — | — |
| MacFarlane Homestead | 0 | — | — | — | — |
| The gated communities | 0 | — | — | — | — |
| Cocoplum | 0 | — | — | — | — |
| Gables Estates | 0 | — | — | — | — |
| Tahiti Beach | 0 | — | — | — | — |
| Old Cutler Bay | 0 | — | — | — | — |
| Gables by the Sea | 0 | — | — | — | — |
| Snapper Creek | 0 | — | — | — | — |
| Hammock Lakes | 0 | — | — | — | — |
| Banyan Lakes | 0 | — | — | — | — |
| Sunrise Harbour | 0 | — | — | — | — |
| Kings Bay | 0 | — | — | — | — |
| Journey's End | 0 | — | — | — | — |
| Deering Bay | 0 | — | — | — | — |
| Hammock Oaks Harbor | 0 | — | — | — | — |
| Neighborhood | Closed sales | Median sale price | Price per square foot | Median vs a year earlier | Median days |
|---|---|---|---|---|---|
| North of US-1 | 0 | — | — | — | — |
| Lettered Sections | 0 | — | — | — | — |
| Country Club Section | 0 | — | — | — | — |
| Granada | 0 | — | — | — | — |
| Biltmore | 0 | — | — | — | — |
| Riviera | 0 | — | — | — | — |
| Gables Waterway / Sans Souci | 0 | — | — | — | — |
| Elsewhere North of US-1 | 0 | — | — | — | — |
| East of US-1 | 0 | — | — | — | — |
| Riviera | 0 | — | — | — | — |
| Biscayne Bay Section | 0 | — | — | — | — |
| Gables Waterway / Sans Souci | 0 | — | — | — | — |
| Elsewhere East of US-1 | 0 | — | — | — | — |
| Next to Coconut Grove | 0 | — | — | — | — |
| Coconut Grove Section | 0 | — | — | — | — |
| Morningside / Sunrise | 0 | — | — | — | — |
| MacFarlane Homestead | 0 | — | — | — | — |
| The gated communities | 0 | — | — | — | — |
| Cocoplum | 0 | — | — | — | — |
| Gables Estates | 0 | — | — | — | — |
| Tahiti Beach | 0 | — | — | — | — |
| Old Cutler Bay | 0 | — | — | — | — |
| Gables by the Sea | 0 | — | — | — | — |
| Snapper Creek | 0 | — | — | — | — |
| Hammock Lakes | 0 | — | — | — | — |
| Banyan Lakes | 0 | — | — | — | — |
| Sunrise Harbour | 0 | — | — | — | — |
| Kings Bay | 0 | — | — | — | — |
| Journey's End | 0 | — | — | — | — |
| Deering Bay | 0 | — | — | — | — |
| Hammock Oaks Harbor | 0 | — | — | — | — |
| Neighborhood | Closed sales | Median sale price | Price per square foot | Median vs a year earlier | Median days |
|---|---|---|---|---|---|
| North of US-1 | 19 | $1,400,000 | $722 | — | 117 |
| Lettered Sections | 0 | — | — | — | — |
| Country Club Section | 0 | — | — | — | — |
| Granada | 0 | — | — | — | — |
| Biltmore | 0 | — | — | — | — |
| Riviera | 0 | — | — | — | — |
| Gables Waterway / Sans Souci | 0 | — | — | — | — |
| Elsewhere North of US-1 | 19 | $1,400,000 | $722 | — | 117 |
| East of US-1 | 0 | — | — | — | — |
| Riviera | 0 | — | — | — | — |
| Biscayne Bay Section | 0 | — | — | — | — |
| Gables Waterway / Sans Souci | 0 | — | — | — | — |
| Elsewhere East of US-1 | 0 | — | — | — | — |
| Next to Coconut Grove | 0 | — | — | — | — |
| Coconut Grove Section | 0 | — | — | — | — |
| Morningside / Sunrise | 0 | — | — | — | — |
| MacFarlane Homestead | 0 | — | — | — | — |
| The gated communities | 0 | — | — | — | — |
| Cocoplum | 0 | — | — | — | — |
| Gables Estates | 0 | — | — | — | — |
| Tahiti Beach | 0 | — | — | — | — |
| Old Cutler Bay | 0 | — | — | — | — |
| Gables by the Sea | 0 | — | — | — | — |
| Snapper Creek | 0 | — | — | — | — |
| Hammock Lakes | 0 | — | — | — | — |
| Banyan Lakes | 0 | — | — | — | — |
| Sunrise Harbour | 0 | — | — | — | — |
| Kings Bay | 0 | — | — | — | — |
| Journey's End | 0 | — | — | — | — |
| Deering Bay | 0 | — | — | — | — |
| Hammock Oaks Harbor | 0 | — | — | — | — |
On the market from $2,000,000, the highest price first.
LIVE · MLS · AS OF NOV 1, 20269 OF 99 FROM $2M SHOWN
1 / 25ACTIVE 1 / 100ACTIVE
 1 / 64ACTIVE
 1 / 57ACTIVE
 1 / 23ACTIVE
 1 / 87ACTIVE
 1 / 30ACTIVE
 1 / 18ACTIVE
 1 / 20ACTIVE
The majority of Coral Gables transactions happen outside the gated communities — in the historic neighborhoods, the luxury townhomes and the new-construction corridors that define the city's character.
In the twelve months to September 29, 2026, 317 single-family homes outside the gated communities closed at a median of $1,915,000, at $1,020 per square foot east of US-1 and $891 north of it. Condos closed at a median of $540,000, and townhomes at $1,450,000 over 24 months (MLS closed sales).
Coral Gables homes for sale and prices →
These Coral Gables figures tell you what a house outside the gated communities costs on each side of US-1: in the twelve months to September 29, 2026, 317 sold at a median of $1,915,000 by MLS closed sales, with a condo's and a townhome's median beside them.
In the twelve months to September 29, 2026, 224 Coral Gables condominiums closed at a median of $540,000, by MLS closed sales. Townhomes closed at a median of $1,450,000 over 24 months.
Coral Gables condos and townhomes →
These Coral Gables figures tell you what a condominium and a townhome sold for, by MLS closed sales to September 29, 2026. They describe the market, not one unit.
Coral Gables has 14 gated communities. Their documented sales ran from $1.6 million to $55 million over 2022–2026, by MLS closed sales and Miami-Dade County public records.
Coral Gables gated communities →
These Coral Gables figures name the 14 gated communities and what their homes sold for, by MLS closed sales and Miami-Dade County public records. They frame the segment, not one home.
Choose a community to see what sellers are asking per square foot and how many homes are for sale. Then open its page.
Every marker on the Coral Gables atlas is one of the 14 gated communities documented in Coral Gables, placed on its real geography; select a marker to read that community.
On each Coral Gables community's placard, the price per square foot is the median asking price of its active listings and the active count is the number of its homes for sale, both read from the MIAMI REALTORS® MLS and stamped with the date of the read: they tell you what that community's sellers are asking and how many homes there are to choose from. Each placard figure carries a status word that says whether its read is live or a stored one.
The documented lines on each Coral Gables community's placard — the price range, the water access and the gate — come from MLS closed sales and Miami-Dade County public records as of the second quarter of 2026, and carry no status word because they do not move by the day.
Enter a community for its own page: the register of its closings, its access to the water and what its buyers pay for.
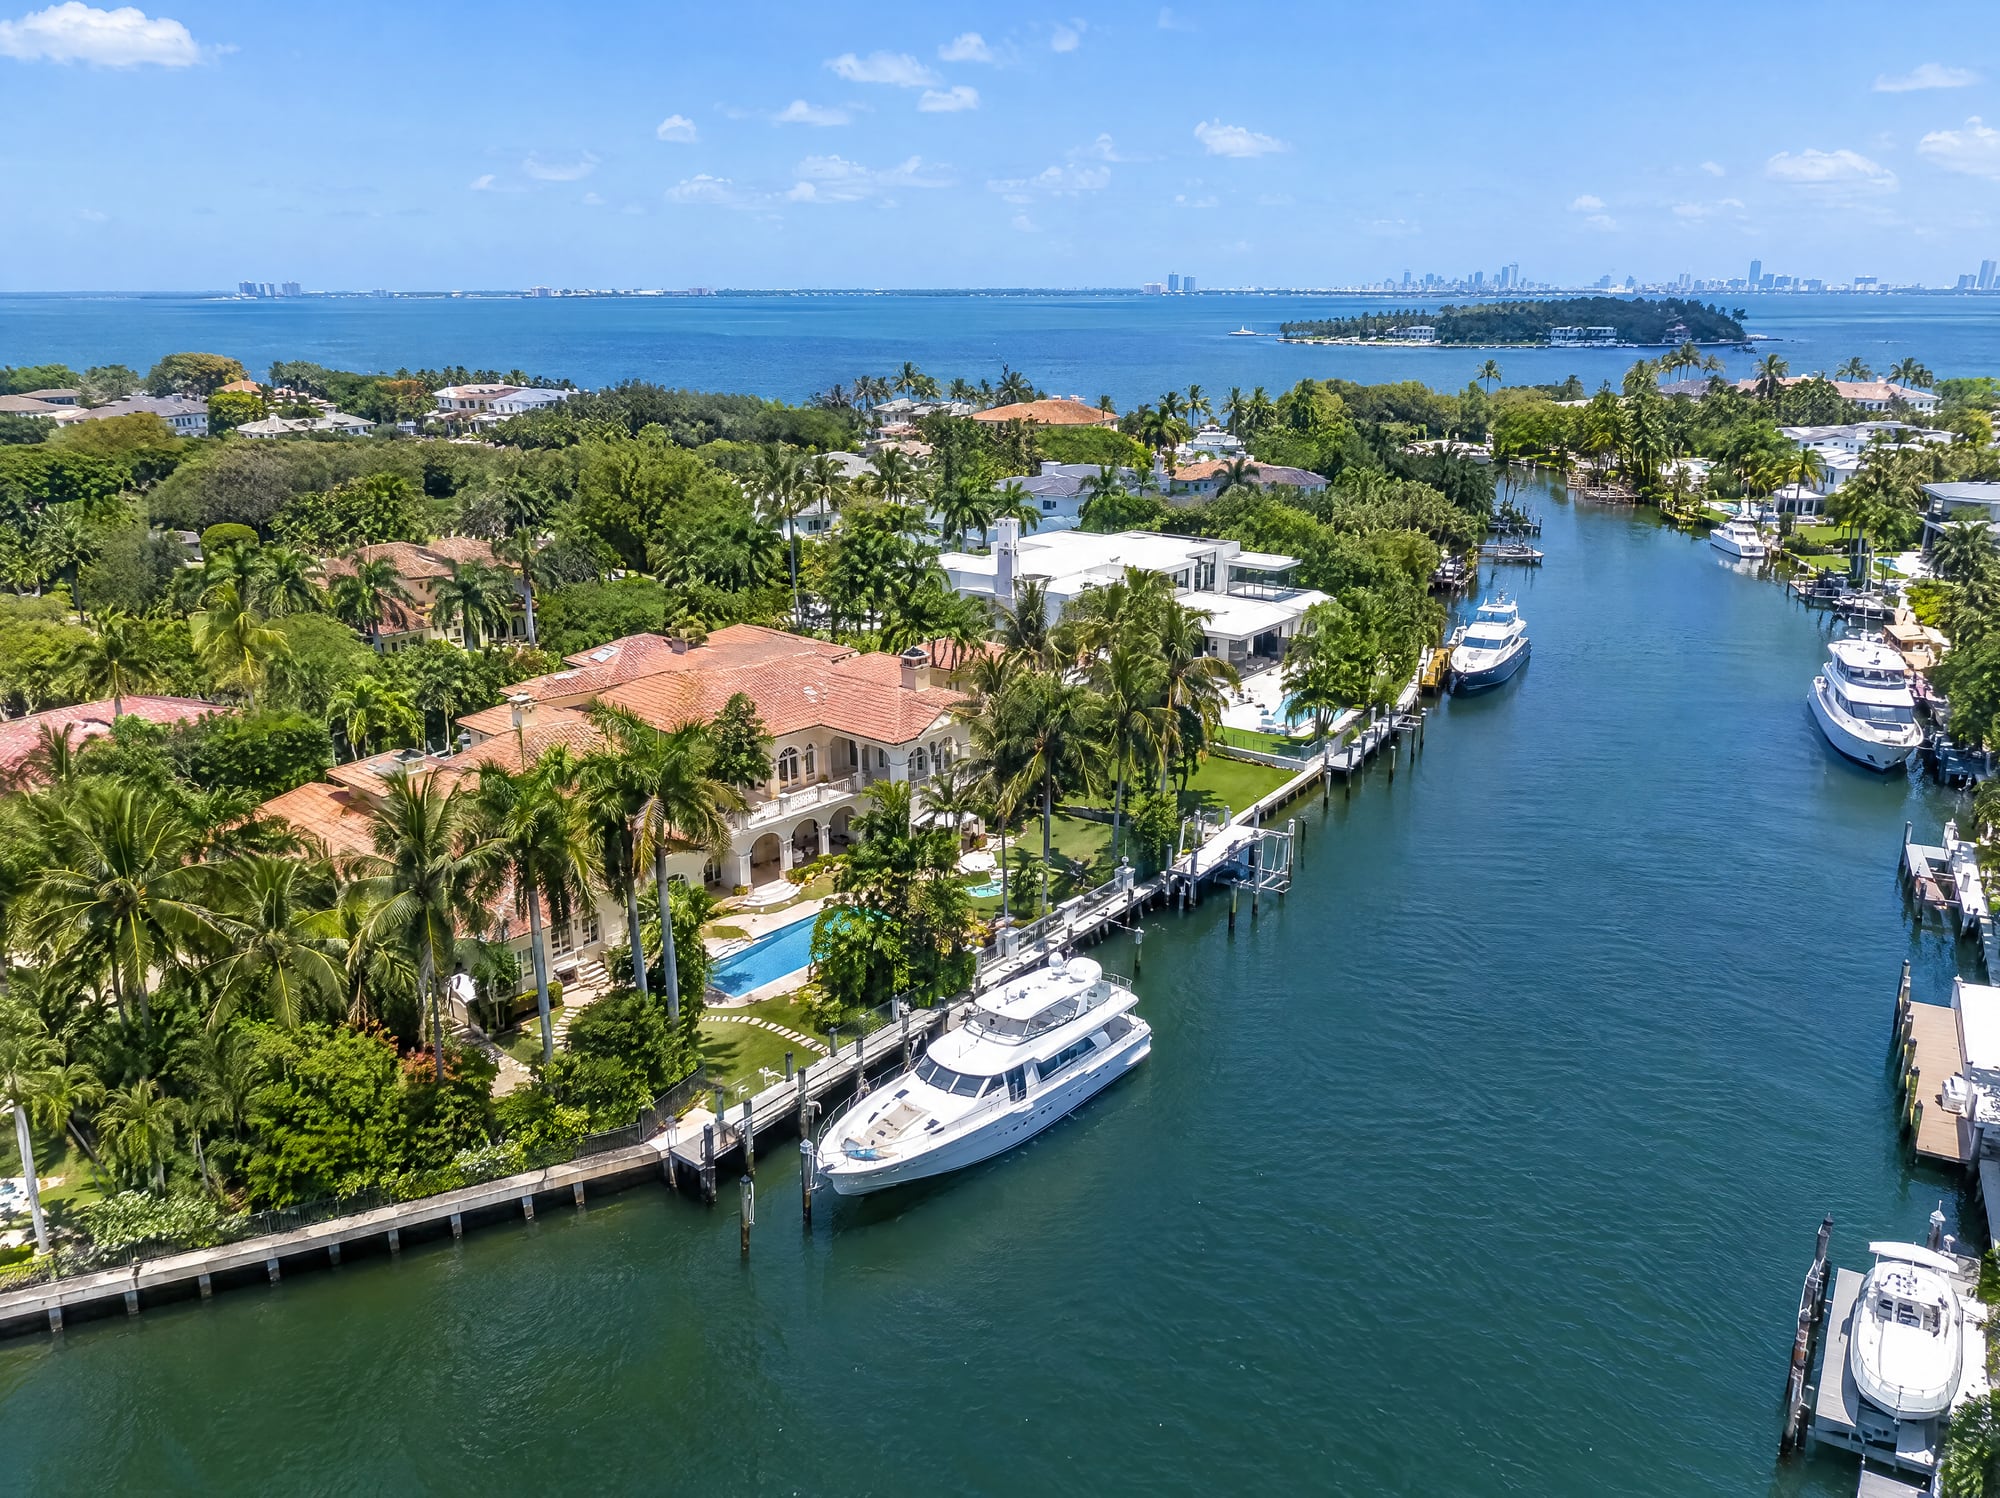
Gables Estates, one of the gated communities of Coral Gables, had documented sales from 2022 to 2026 that ran from $10.5 million to $55 million (MLS closed sales and Miami-Dade County public records).
The atlas places each Coral Gables gated community on the map with what its sellers are asking per square foot and how many of its homes are for sale, read live from the MIAMI REALTORS® MLS. It shows where each community lies and what a buyer can choose from inside its gates today, not what its homes sold for.
Outside the gated communities, 43 Coral Gables waterfront homes sold from 2022 to September 29, 2026, at a median of $1,270 per square foot, by MLS closed sales. A home sits on one of four kinds of water, from no fixed bridges to a lake.
Coral Gables waterfront homes →
These Coral Gables figures tell you what a waterfront home outside the gated communities sold for, by MLS closed sales to September 29, 2026. What a home is worth depends on its water.
Coral Gables has one of the most constrained new construction pipelines in South Florida. 6 projects are currently active, delivered, or available for purchase.
Coral Gables new construction →
These 6 Coral Gables projects, active, delivered or for sale, are the new homes coming to a city with little land left to build on, each from its developer's own published materials. They show what new supply is coming and where, not what a finished unit will sell for.
Coral Gables is a city of its own, planned from 1921. Five documented facts set it apart from the rest of Miami.
A Board of Architects reviews every new house, addition and exterior alteration before a permit is issued.
Ryder System's global headquarters and Bradesco Bank's U.S. headquarters are in Coral Gables, and FIFA, Apple and Bacardi USA have offices in the city.
Ransom Everglades ranks among the top 10 private schools in North America (Spear's 2024, 2025, 2026). It is the only school in Florida or the Southeast with this distinction.
121.7% over ten years in NeighborhoodScout's national index, among its top-ranked cities. A $55M record reached twice — in 2025 and again in 2026. Appreciation driven by scarcity, not speculation.
The land is built out. Zoning prevents densification. New construction is infill only. You cannot build more Coral Gables.
In a market this documented, individual events are the market. A new listing behind a gate resets the negotiations around it; one price cut in a canal community re-anchors its whole band; a pending sale tells you what the last week was actually worth.
The dated market report adds these events up. A sale that was never listed first shows here, as a closing.
The feed shows each Coral Gables listing, sale and price change as the MIAMI REALTORS® MLS records it. It tells you what is moving in the Coral Gables market this week; the dated market report is where those events add up.
Every review here was written by a client on Julian Acosta's Google Business Profile, and each one links to where it was written.
“Partnering with Julian to sell properties in Pinecrest and Coral Gables has been an outstanding experience. He handles every detail with professionalism and expertise. I highly recommend him as a top-notch Realtor!”
“Julian Acosta is an excellent Realtor. He is attentive and very professional. Specialist in areas such as Pinecrest, Coral Gables and South Miami. We have worked many projects together and more are coming!”
“Julian couldn’t have been more diligent selling my coral gables property in record time. He was fast, diligent, knowledgeable and made the process so easy. If you want a truly exceptional experience, he’s the person to go to. Looking forward to doing more business with him.”
“Julian is the Top Realtor in Coral Gables. I’ve referred a few family members and friends. And, he was always on top of the negotiation. 100% recommended!”
“Julian is truly a professional. The best realtor in Coral Gables. Extremely prepared, knowledgeable and truthful. Hire him without hesitation”
“Julian is a great partner in your dream house search in Pinecrest. He is commited in making sure you are very happy with your purchase. Best realtor in Pinecrest!”
71 Google reviews, rated 5.0, read OCT 31, 2026
If that's how you want your sale or your purchase in Coral Gables handled, let's talk.
Schedule a consultation↗The same data that informs buyers tells sellers everything they need to know. Coral Gables favors the seller slightly: in the twelve months to September 30, 2026, single-family homes closed at a median of 94.3% of their last list price after 48 days, by MLS closed sales.
These numbers tell a Coral Gables seller where a house lands. In the twelve months to September 30, 2026, Coral Gables single-family homes closed at a median of 94.3% of their last list price after 48 days, by MIAMI REALTORS® MLS closed sales. They describe the market's sales, not what one home will fetch.
Julian Acosta operates inside the Coral Gables market full-time, at every price and in every gated community.
About this page. The market figures on this Coral Gables page are read from MLS closed sales (Compass, first-party) to September 29, 2026, from Miami-Dade County public records and from the sources named where they are cited, and each carries its window where it appears. A live figure says so and is read from the MIAMI REALTORS® MLS.
This Coral Gables page presents market analysis based on MLS closed transactions, Miami-Dade County public records and Julian Acosta's first-party knowledge. It is not a certified appraisal, legal advice or an investment recommendation.