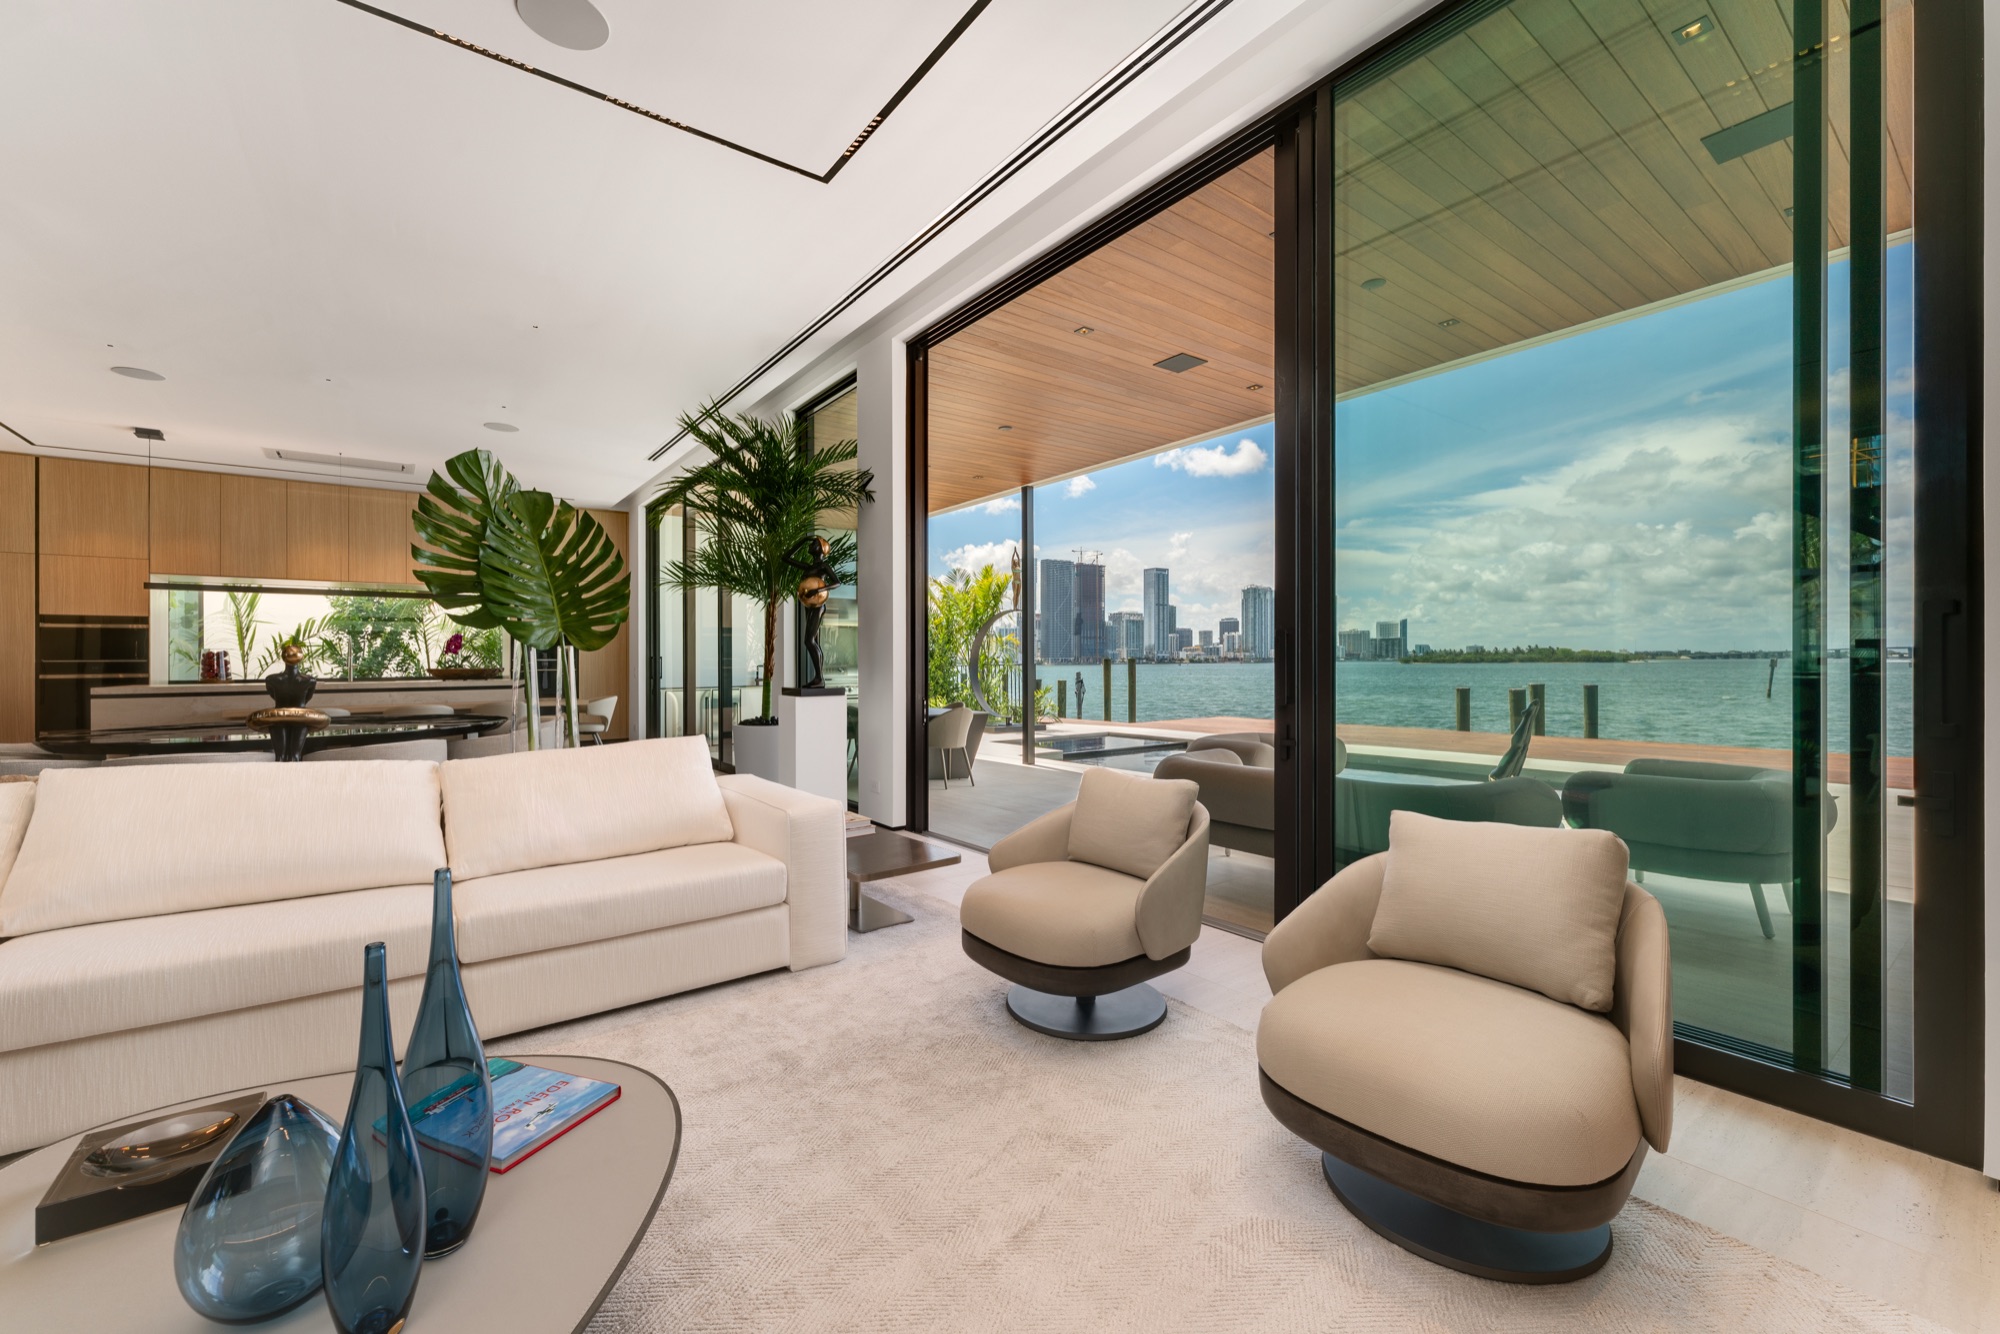
 1 / 20ACTIVE
$22,000,000
6 beds | 7 baths | 0.75 acres
612 Sunset Dr, Coral Gables, FL 33143
LISTED BY Douglas Elliman↗
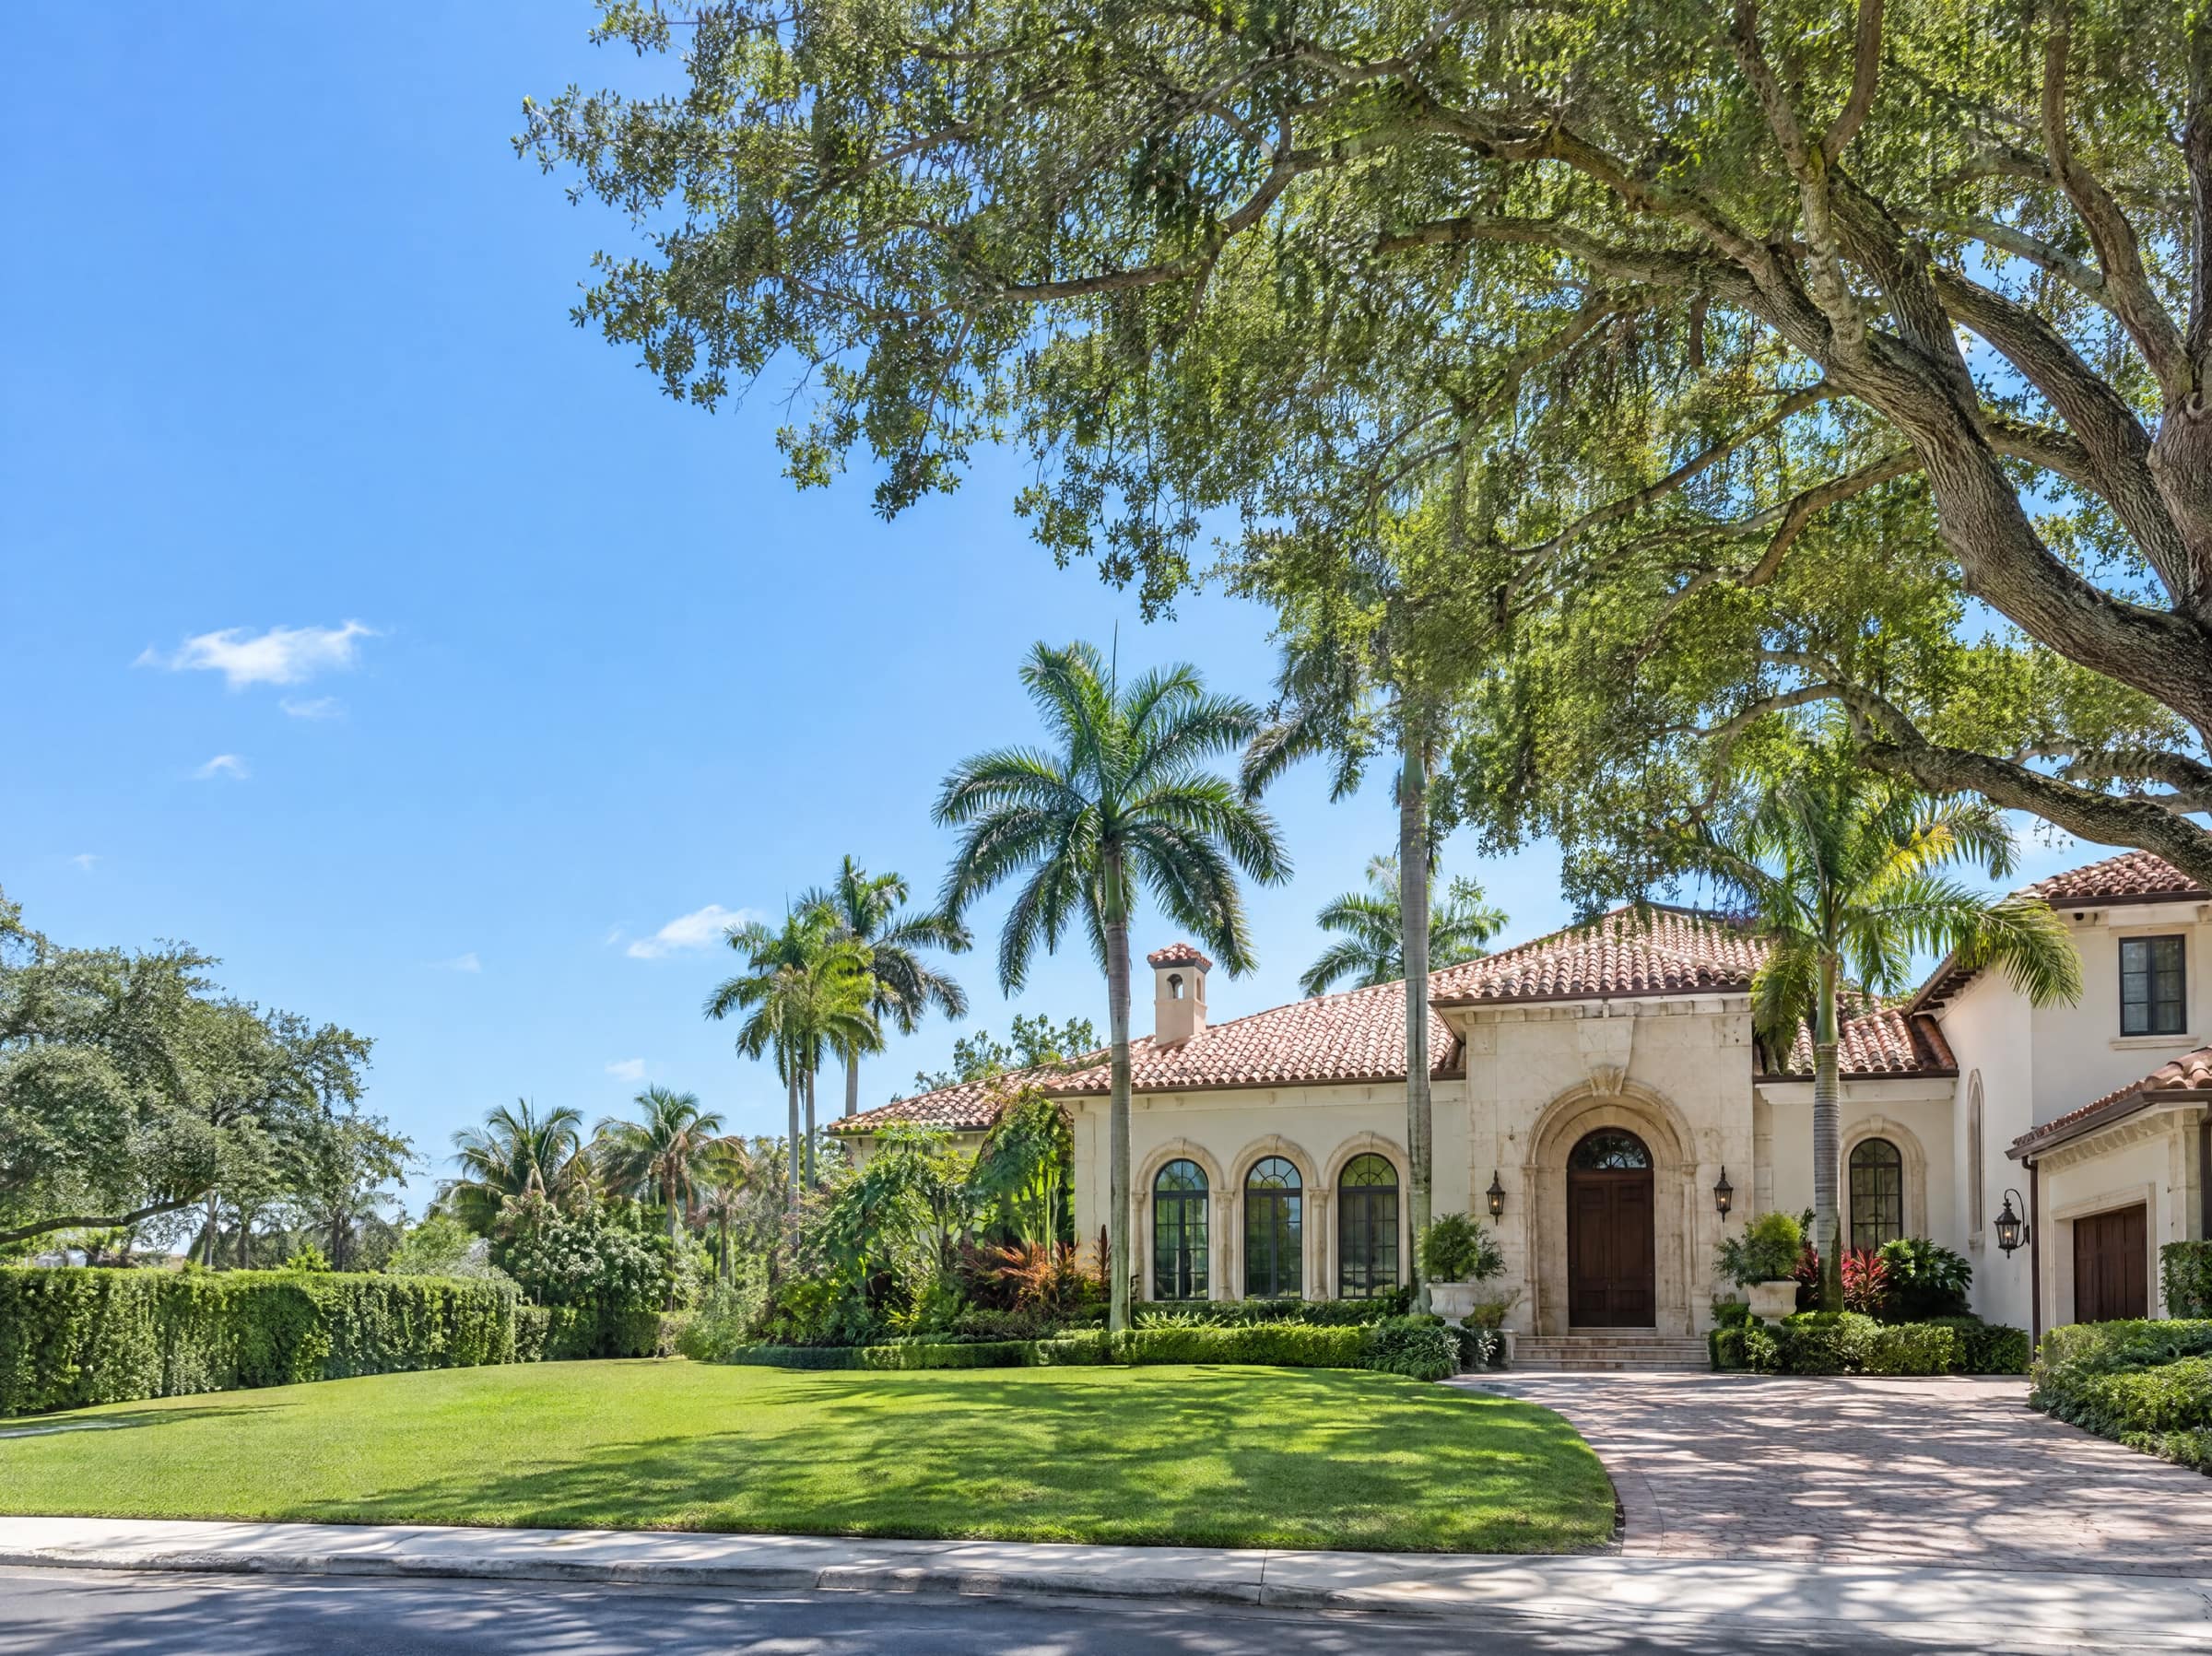
Single-family homes in Coral Gables outside the gated communities: 1,557 closed sales since 2022, read by side of US-1 and by the age of the house, from the MLS and Miami-Dade County's public record.
Single-family homes outside Coral Gables' gated communities closed at a median of $1,915,000 in the twelve months to September 29, 2026, from 317 sales, according to MIAMI REALTORS® MLS closed sales. The median price per square foot was $891 north of US-1 and $1,020 east of it.
This answer states the median of a Coral Gables house outside the gated communities, $1,915,000, by MLS closed sales.
Most of Coral Gables' single-family market lies outside its gated communities: 1,557 closed sales from 2022 to September 29, 2026, 85% of the city's single-family sales (MLS closed sales). In the twelve months to September 29, 2026, half of the Coral Gables single-family sales outside the gated communities closed between $1,305,000 and $2,900,000. The highest Coral Gables single-family sale outside the gated communities since 2022 on the County record closed at $32,000,000, on Riviera Drive, in December 2025.
Outside its gated communities lies the larger part of Coral Gables' single-family market: 1,557 houses closed there from 2022 to September 29, 2026, 85% of the city's single-family sales, and in the last twelve months their median was $1,915,000, or $898 per square foot (MLS closed sales; Miami-Dade County Property Appraiser).
Each figure in this Coral Gables homes glance is documented from MLS closed sales, the highest sale from the Miami-Dade County Property Appraiser's record, carries its window beside it and is written out as text so it can be cited; none is a live read.
On the market from $2,000,000, outside the gated communities, the highest price first.
LIVE · MLS · AS OF OCT 31, 20269 OF 55 FROM $2M SHOWN
1 / 20ACTIVE 1 / 48ACTIVE
 1 / 52ACTIVE
 1 / 93ACTIVE
 1 / 35ACTIVE
 1 / 28ACTIVE
 1 / 76ACTIVE
 1 / 45ACTIVENew
 1 / 26ACTIVE
In the twelve months to September 29, 2026, 317 Coral Gables single-family homes outside the gated communities closed at a median of $1,915,000; the middle half of them at $1,305,000 – $2,900,000, and by price per square foot at $753–$1,046. Half of the Coral Gables homes outside the gated communities sold within 42 days of listing, the median days on the market (MLS closed sales).
Single-family homes outside the gated communities · twelve months
AS OF September 29, 2026
Sales by sub-market
Median price per square foot
| Sub-market | Median sale price | Sales | Median $/SF | Price, middle half |
|---|---|---|---|---|
| All | $1,915,000 | 317 | $898/SF | $1,305,000 – $2,900,000 |
| North of US-1 | $1,775,000 | 236 | $891/SF | $1,300,000 – $2,750,000 |
| East of US-1 | $2,700,000 | 58 | $1,020/SF | $2,065,000 – $3,500,000 |
| Next to Coconut Grove | $1,250,000 | 23 | $873/SF | $957,500 – $2,512,500 |
◆ MLS closed sales (Compass, first-party)
| Metric | Value | Note |
|---|---|---|
| Single-family sales | 1,557 | Outside the gated communities, since 2022 |
| Median sale price | $1,915,000 | 12 months · 317 sales |
| North of US-1 — median $/SF | $891/SF | 236 sales in 12 months · $795/SF since 2022 |
| East of US-1 — median $/SF | $1,020/SF | 58 sales in 12 months · $923/SF since 2022 |
| Edge / East — median $/SF | $873/SF | 23 sales in 12 months · $772/SF since 2022 |
| $/SF, middle half | $753–$1,046/SF | On living area, 12 months |
| Price, middle half | $1,305,000 – $2,900,000 | Outside the gated communities, 12 months |
| Highest sale since 2022 | $32,000,000 | Riviera Drive, December 2025 · a qualified sale on the County record |
| Waterfront sales | 43 | Outside the gated communities, since 2022 · 26 north of US-1, 17 east |
| Median days on market | 42 days | 12 months |
The Coral Gables sales on this page are the market's, read from MLS closed sales, not Julian Acosta's own.
In these Coral Gables figures, price per square foot is the sale price over the living area, and the middle half runs from the 25th to the 75th percentile of the sales, read to September 29, 2026 by MLS closed sales. The value of a single Coral Gables property is its own: a median describes the market, not one house.
The last twelve months, 317 sales at a median of $1,915,000 to September 29, 2026 and a median of 42 days on the market by MLS closed sales, show at what price and how fast Coral Gables houses outside the gated communities sell; one house's time on the market follows its own price and condition.
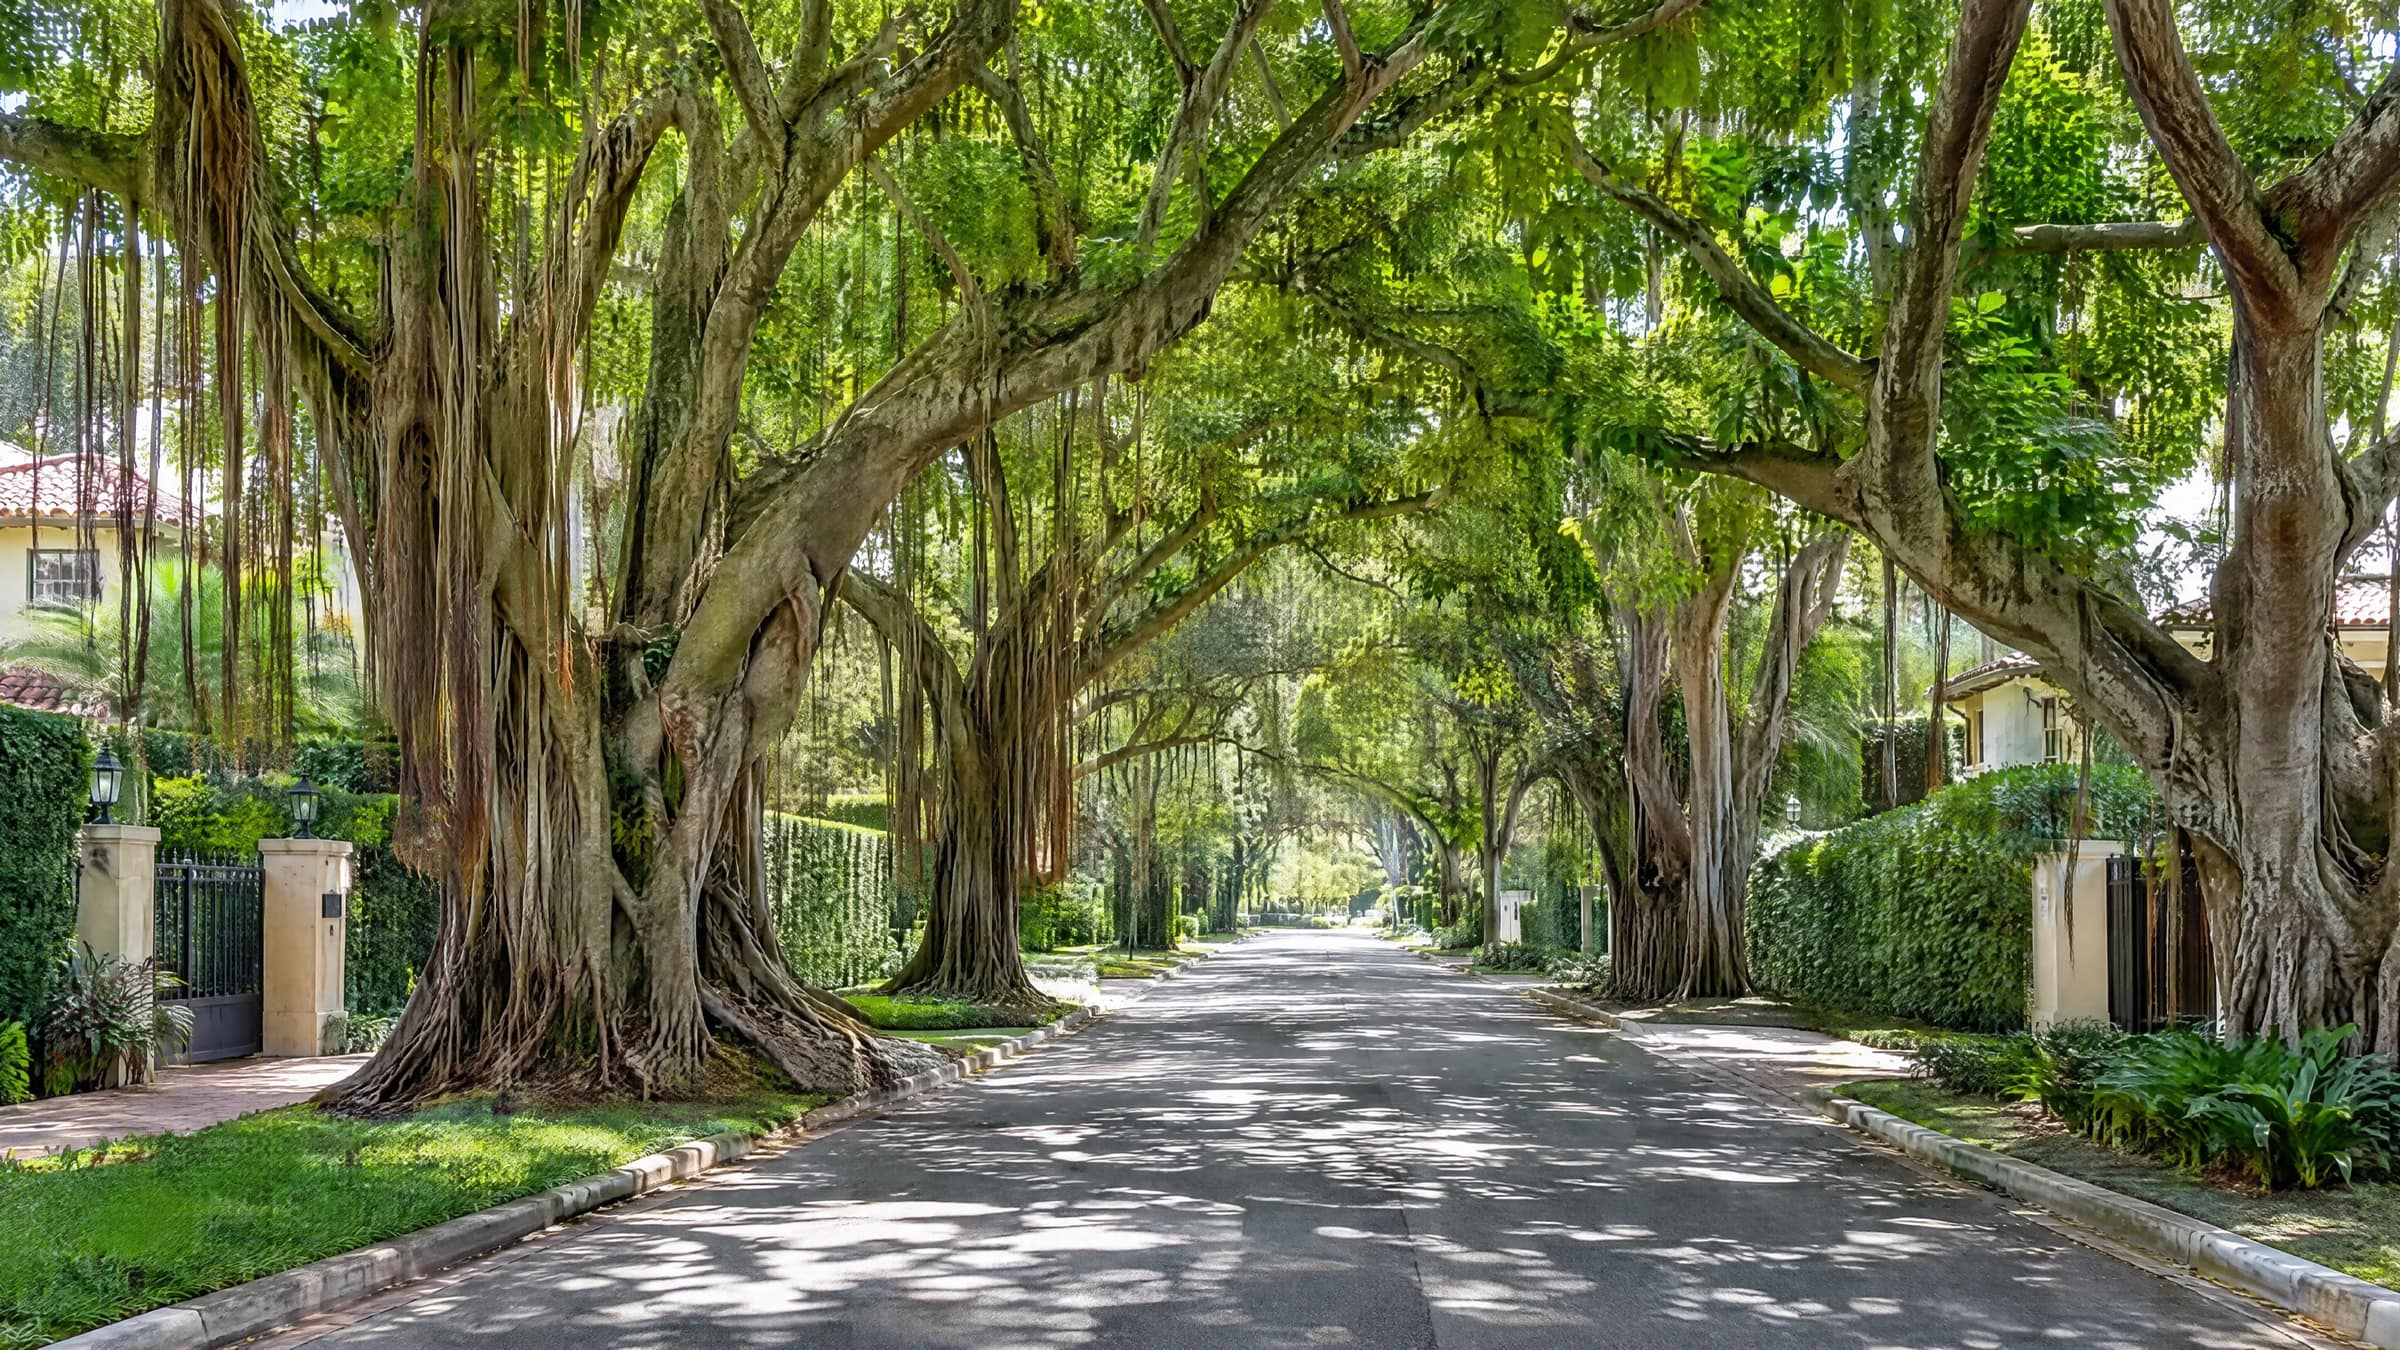
In Coral Gables, the oldest houses stand north of US-1, South Dixie Highway, and the larger lots lie east of it, by MLS closed sales.
US-1, South Dixie Highway, crosses Coral Gables once, from the southwest to the northeast: it enters the city from South Miami at SW 57th Avenue and leaves it for the City of Miami near SW 38th Avenue, by Miami-Dade County's road and municipal-boundary layers. The Coral Gables homes market outside the gated communities divides along US-1 into a north side, an east side and the neighborhoods next to Coconut Grove. Outside the gated communities, 1,144 of the 1,557 Coral Gables single-family sales since 2022 were north of US-1, 321 east of it, and 92 in the neighborhoods next to Coconut Grove (MLS closed sales).
Each sub-market is read by its median of the last twelve months and the middle half of its sales: a quarter closed below that range and a quarter above it. The group next to Coconut Grove is read by plat and taken out of the two sides, so the north and east sub-markets on this page are smaller than the two sides of US-1 in the Complete Guide, which counts every sale on its side.
| Neighborhood | Sub-market | Median $/SF | Sales | $/SF, middle half |
|---|---|---|---|---|
| 1 · Coral Gables Sections A–E | North of US-1 | $896/SF | 124 | $755–$1,058/SF |
| 2 · Country Club Section | North of US-1 | $916/SF | 98 | $781–$1,070/SF |
| 3 · Granada | North of US-1 | $817/SF | 73 | $688–$896/SF |
| 4 · Biltmore | North of US-1 | $908/SF | 13 | $779–$1,029/SF |
| 5 · Riviera | East of US-1 | $956/SF | 132 | $851–$1,175/SF |
| 6 · Biscayne Bay Section | East of US-1 | $1,206/SF | 14 | $1,032–$1,275/SF |
| 7 · Sans Souci | East of US-1 | — | 8 | — |
| 8 · Coconut Grove (CG portion) | Next to Coconut Grove | $812/SF | 32 | $637–$877/SF |
| 9 · Sunrise Point | Next to Coconut Grove | — | 9 | — |
| 10 · MacFarlane Homestead | Next to Coconut Grove | — | 7 | — |
MLS closed sales (Compass, first-party)
Coral Gables Homes — Three Sub-Markets (MLS closed sales to September 29, 2026)
AS OF September 29, 2026
North of US-1, Coral Gables homes outside the gated communities closed 1,144 sales since 2022, 236 of them in the last twelve months, at a median of $891 per square foot ($795 since 2022); the middle half closed at $729–$1,026 per square foot and at $1,300,000 – $2,750,000. North of US-1 is the historic core of Merrick-era architecture, around the Biltmore, the Venetian Pool and Miracle Mile, and it holds both the teardown lot and the rebuilt house on the same streets. 26 of the north side's sales since 2022 were on the water.
East of US-1, Coral Gables homes outside the gated communities closed 321 sales since 2022, 58 of them in the last twelve months, at a median of $1,020 per square foot ($923 since 2022); the middle half closed at $883–$1,232 per square foot and at $2,065,000 – $3,500,000. 17 of the east side's sales since 2022 were on the water.
Next to Coconut Grove, Coral Gables homes outside the gated communities closed 92 sales since 2022, 23 of them in the last twelve months, at a median of $873 per square foot and a median price of $1,250,000, the lowest of the three sub-markets. The group is three neighborhoods next to Coconut Grove: the Coral Gables portion of Coconut Grove, MacFarlane Homestead and Sunrise Point.
Sales by sub-market
Median price per square foot
| Sub-Market | Median $/SF (12 months) | Sales (12 months) | $/SF, Middle Half | Price, Middle Half |
|---|---|---|---|---|
| All | $898/SF | 317 | $753–$1,046/SF | $1,305,000 – $2,900,000 |
| North of US-1 | $891/SF | 236 | $729–$1,026/SF | $1,300,000 – $2,750,000 |
| East of US-1 | $1,020/SF | 58 | $883–$1,232/SF | $2,065,000 – $3,500,000 |
| Next to Coconut Grove | $873/SF | 23 | $600–$902/SF | $957,500 – $2,512,500 |
◆ MLS closed sales (Compass, first-party)
In these Coral Gables figures, price per square foot is the sale price over the living area, by MLS closed sales. The Coral Gables medians and middle halves here are of the twelve months to September 29, 2026, and the middle half runs from the 25th to the 75th percentile: the range in which half of the sales closed. These Coral Gables figures count single-family homes outside the gated communities only; a sale inside a gated community's security district or plat is counted with that community. A Coral Gables neighborhood's median here is of the 24 months to September 29, 2026, and is stated only for a neighborhood with 10 or more sales in that window.
Riviera, the Coral Gables neighborhood beside the University of Miami, lies on both sides of US-1: of its 132 single-family sales in the 24 months to September 29, 2026, 77 were east of US-1 and 55 north of it, by MLS closed sales.
Coral Bay, in Coral Gables, is not in the cards: its plats lie inside the security district of Gables by the Sea, so its sales are read with that community on Gated Communities →.
The three sub-markets read a Coral Gables house against its own side of US-1: in the twelve months to September 29, 2026, the median was $891 per square foot north and $1,020 east by MLS closed sales, so a house is compared with the sales on its own side.
The median Coral Gables single-family home outside the gated communities sold for $1,467,500 in 2022, $1,565,000 in 2023, $1,700,000 in 2024 and $1,975,000 in 2025, higher each year (MLS closed sales). Through September 29, 2026, the median Coral Gables single-family home outside the gated communities sold for $1,950,000 in 2026, on 238 sales (MLS closed sales).
The median price per square foot of a Coral Gables single-family home outside the gated communities rose from $714 in 2022 to $876 in 2025, and is $906 in 2026 to September 29, 2026 (MLS closed sales).
A median is the middle sale of its year: half of the homes sold for more, half for less. Read year after year, the median shows you which way the Coral Gables single-family market moved; it is not the value of one house, which its lot, its size, its street and its condition set. To price a house, start with a comparative market analysis.
Coral Gables single-family homes outside the gated communities by year · MLS closed sales since 2022
AS OF September 29, 2026
Median price
Homes
2026: January to September 29, 2026
| Year | Home sales | Median home price | Median home $/SF |
|---|---|---|---|
| 2022 | 368 | $1,467,500 | $714/SF |
| 2023 | 327 | $1,565,000 | $787/SF |
| 2024 | 307 | $1,700,000 | $849/SF |
| 2025 | 317 | $1,975,000 | $876/SF |
| 2026: January to September 29, 2026 | 238 | $1,950,000 | $906/SF |
MLS closed sales (Compass, first-party)
The yearly figures for Coral Gables homes outside the gated communities are MLS closed sales of single-family homes by the year they closed, from 2022 to September 29, 2026, so 2026 runs only to that day. In these Coral Gables figures, a home inside a gated community's security district or plat is counted with that community, and the median $/SF is read on the living area.
The yearly medians of Coral Gables homes outside the gated communities, $1,467,500 in 2022 to $1,975,000 in 2025 by MLS closed sales, show which way their prices moved; a median is the middle of a year's sales, so one house is priced from its own comparable sales.
In the twelve months to September 29, 2026, Coral Gables houses outside the gated communities built between 1920 and 1960, the Merrick era, closed at a median of $902 per square foot, against $843 for houses built between 1961 and 2000 and $1,061 for houses built since 2001 (MLS closed sales).
Coral Gables' Merrick-era houses closed above those built from 1961 to 2000, in median price per square foot, in every year since 2022. These are medians of closed sales: they do not hold location, size or renovation equal, and a single house is read against its own street.
| Era | Median $/SF | Sales, 12 months |
|---|---|---|
| Built 1920 to 1960, the Merrick era | $902/SF | 216 |
| Built 1961 to 2000 | $843/SF | 63 |
| Built 2001 or later | $1,061/SF | 38 |
The median by era of building, $902 per square foot for Merrick-era Coral Gables houses against $843 for those built from 1961 to 2000 in the twelve months to September 29, 2026 by MLS closed sales, shows what the market has paid for the age and style of a house; it does not hold location, size or renovation equal.
Most of Coral Gables is not behind a gate: 317 of the 389 single-family homes sold in the twelve months to September 29, 2026 were outside the 14 gated communities, at a median of $1,915,000 — against $7,065,750 inside them.
| Side of US-1 | Median price | Sales | $/SF · middle half | Lot · middle half | Median year built | Median days on market |
|---|---|---|---|---|---|---|
| North of US-1 | $1,715,000 | 251 | $715 – $1,018 | 5,562 – 10,500 SF | 1952 | 42 |
| East of US-1 | $2,637,500 | 66 | $881 – $1,222 | 8,776 – 12,325 SF | 1960 | 40.5 |
| Section, by the MLS plat name | Sales | Median price | $/SF · middle half | Lot · middle half |
|---|---|---|---|---|
| Riviera | 132 | $2,275,000 | $851 – $1,175 | 6,805 – 12,000 SF |
| Coral Gables Sections A–E | 124 | $2,002,500 | $755 – $1,058 | 5,650 – 12,784 SF |
| Country Club | 98 | $2,178,750 | $781 – $1,070 | 6,525 – 12,601 SF |
| Granada | 73 | $1,370,000 | $688 – $896 | 5,200 – 9,000 SF |
| Coconut Grove Section | 32 | $1,275,000 | $637 – $877 | 5,250 – 7,500 SF |
| Biscayne Bay Section | 14 | $2,921,500 | $1,032 – $1,275 | 9,929 – 11,489 SF |
| Biltmore | 13 | $1,850,000 | $779 – $1,029 | 7,500 – 10,000 SF |
It is the city George Merrick planned — mapped on paper by early 1921 and incorporated on April 29, 1925 — and the plats recorded after it: the lettered sections, Granada, the Country Club Section in six parts, Crafts, Biltmore, the Riviera Section, the Biscayne Bay Section, the Coconut Grove Section and the rest the City's zoning code lists by name. No guardhouse and, almost always, no association: 4 of the 317 sales outside the gated communities reported one. Since 2022, 1,557 of the city's 1,827 single-family sales have been outside the gated communities, 85%.
Two differences show in the same twelve months. Homes outside the gates sold in a median 42 days on market, against 84.5 inside them. And the water is mostly inside the gates: 41 of the 72 gated sales were waterfront, 11 of the 317 outside the gates.
US-1 — South Dixie Highway — crosses Coral Gables from the southwest to the northeast. North of US-1 lie the lettered sections, Granada, the Country Club Section, Biltmore and the Coconut Grove Section; east of US-1, the part of the Riviera Section on that side, the Biscayne Bay Section and, nearer the bay, the gated communities. North of US-1, Coral Gables carries 251 of the 317 single-family sales outside the gated communities in the twelve months to September 29, 2026, by MLS closed sales, on smaller and older lots; east of US-1 the lots are larger and the median price is higher by $922,500.
The lettered sections and Granada hold the oldest houses in the table: sales in Coral Gables Sections A to E have a median year built of 1938. Granada, the northernmost of them, shares its name with the City's Granada Golf Course, opened in 1923. The Country Club Section was platted in six parts; Part One opened in 1924. The Biltmore Section opened with the Country Club's Part Six on August 24, 1925 — the year Donald Ross designed the Biltmore Golf Course. The Coconut Grove Section is the easternmost of these northern residential sections.
Across the city, every new house, addition and exterior alteration is reviewed by the Board of Architects before a permit is issued, minor items by the City Architect. A property on the Coral Gables Register of Historic Places — more than 1,000 are — needs a certificate of appropriateness, and demolishing even an undesignated building needs the Historic Preservation Officer's approval. In the older sections, that is what an owner can and cannot change.
The Riviera Section is the one large section on both sides of US-1. Merrick promoted it in 1925 together with the University of Miami, whose campus was drawn on Riviera Section land. In the twenty-four months to September 29, 2026 it was the busiest section outside the gated communities: 132 sales at a median of $2,275,000 — 55 north of US-1 at a median of $2,000,000 and 77 east of it at $2,375,000. 13 of the 132 were on the water.
A historic district immediately east of US-1: its land was bought in 1925 and its first houses — frame vernacular bungalows and shotgun houses — were built in 1926. The City designated it in 1989, and in 1994 it was listed on the National Register of Historic Places — the only historic district in Coral Gables on the National Register. It and the Crafts Section closed fewer than 10 sales each in the window and carry no figures here.
The Coral Gables homes page reads each sub-market outside the gated communities on its own: what sold and at what price.
This chapter shows that most of Coral Gables is outside a gate: 317 of the 389 single-family homes sold in the twelve months to September 29, 2026, at $1,915,000 for the sale in the middle, against $7,065,750 inside the 14 gated communities, by MLS closed sales. It tells you where most of the market trades.
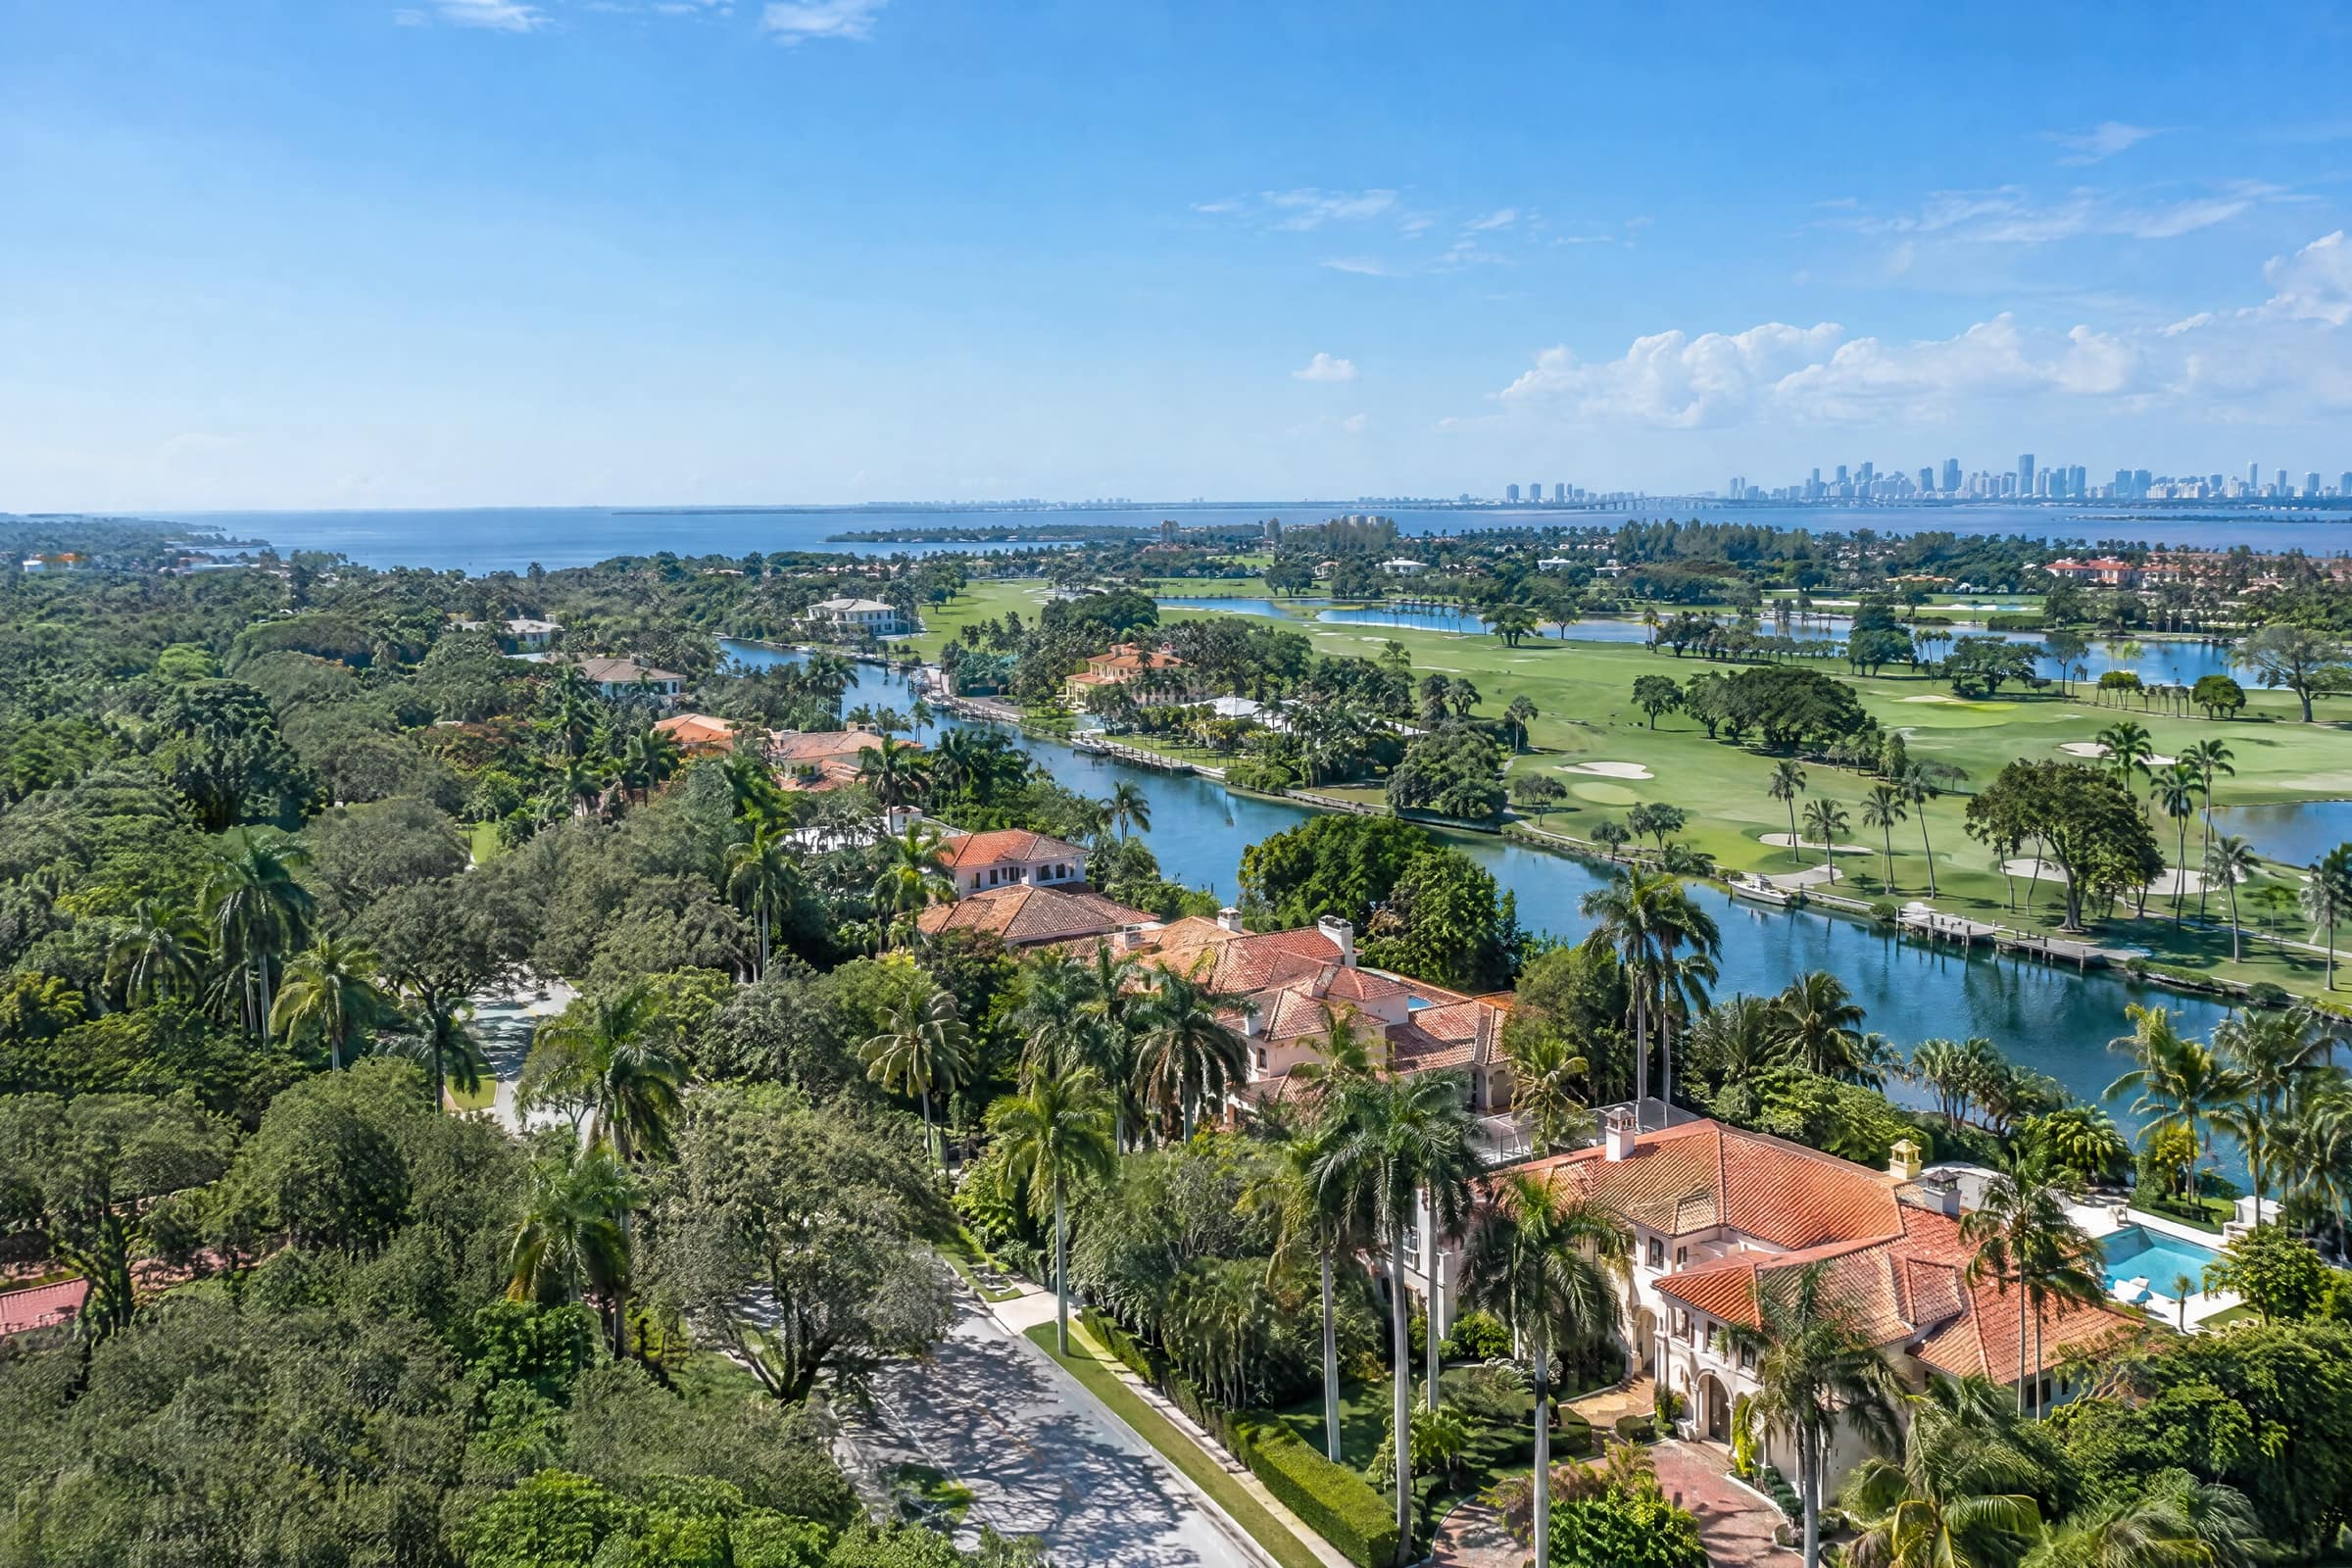
In Coral Gables, a house can come down so that a new one rises on the same lot.
Teardown lots in North Coral Gables trade at $100 to $140 per square foot of land, by Julian Acosta's own read of October 3, 2026, so a lot of 14,000 SF comes to $1.4M–$1.96M; finished new construction sells at $1,043–$1,363 per square foot (the Coral Gables market snapshot, the second quarter of 2026).
A teardown is a lot bought for its land: an older house comes down and a new one goes up. The cost of the land and the price of the finished house per square foot are the two figures a rebuild is priced on.
| Read | Value | Note |
|---|---|---|
| Land, per square foot | $100 to $140 | Julian Acosta's own read, October 3, 2026 |
| A lot of 14,000 SF | $1.4M–$1.96M | At that price per square foot of land |
| Finished new construction | $1,043–$1,363/SF | Julian Acosta's read, the second quarter of 2026 |
A rebuild in North Coral Gables is priced on two figures: the land, $1.4M–$1.96M for a lot of 14,000 SF by Julian Acosta's read of October 3, 2026, and the finished house, $1,043–$1,363 per square foot by Julian Acosta's read of the second quarter of 2026; together they show whether a teardown's numbers work, and a lot is priced from its own land sales.
Property tax and insurance are the two recurring costs to price before an offer on a Coral Gables home. At the 2025 adopted millage of 18.1852 mills, before any exemption, a Coral Gables home pays $27,278 a year on a taxable value of $1,500,000, and $36,370 on $2,000,000 (Miami-Dade County Property Appraiser).
Florida's homestead exemption lowers a Coral Gables primary residence's taxable value by $25,000, and by up to $26,411 more on the non-school levies (2026).
An estimate at the adopted millage, before the City's charges on the same bill (solid waste and fire protection) and before the Save Our Homes cap. A home's own tax comes from its assessed value and its exemptions.
Tax a year · 2025 adopted millage
$27,278
$2,273 a month
| Taxable value | Tax a year |
|---|---|
| $1,500,000 | $27,278 |
| $2,000,000 | $36,370 |
| $3,000,000 | $54,556 |
| $5,000,000 | $90,926 |
Miami-Dade County Property Appraiser, adopted millage for Coral Gables
The average homeowners policy with wind coverage in Miami-Dade County costs $5,975 a year (Florida Office of Insurance Regulation, policies in force on March 31, 2026). A premium follows the house, its age, its roof, its elevation and the coverage chosen, not a percentage of its price.
The full account of owning a home in Coral Gables, the levies line by line, the City's assessments, wind and flood, is the Complete Guide's Cost of Owning in Coral Gables →.
The costs of owning in these Coral Gables figures are estimates only: property tax depends on assessed value, the homestead exemption and the millage rate, and insurance on the property and the coverage, so verify every figure with a licensed professional before a purchase.
Property tax and insurance are the two costs to add before an offer on a Coral Gables home: the tax is $27,278 a year on a taxable value of $1,500,000 at the 2025 adopted millage of the Miami-Dade County Property Appraiser; a house's own tax comes from its assessed value and its exemptions.
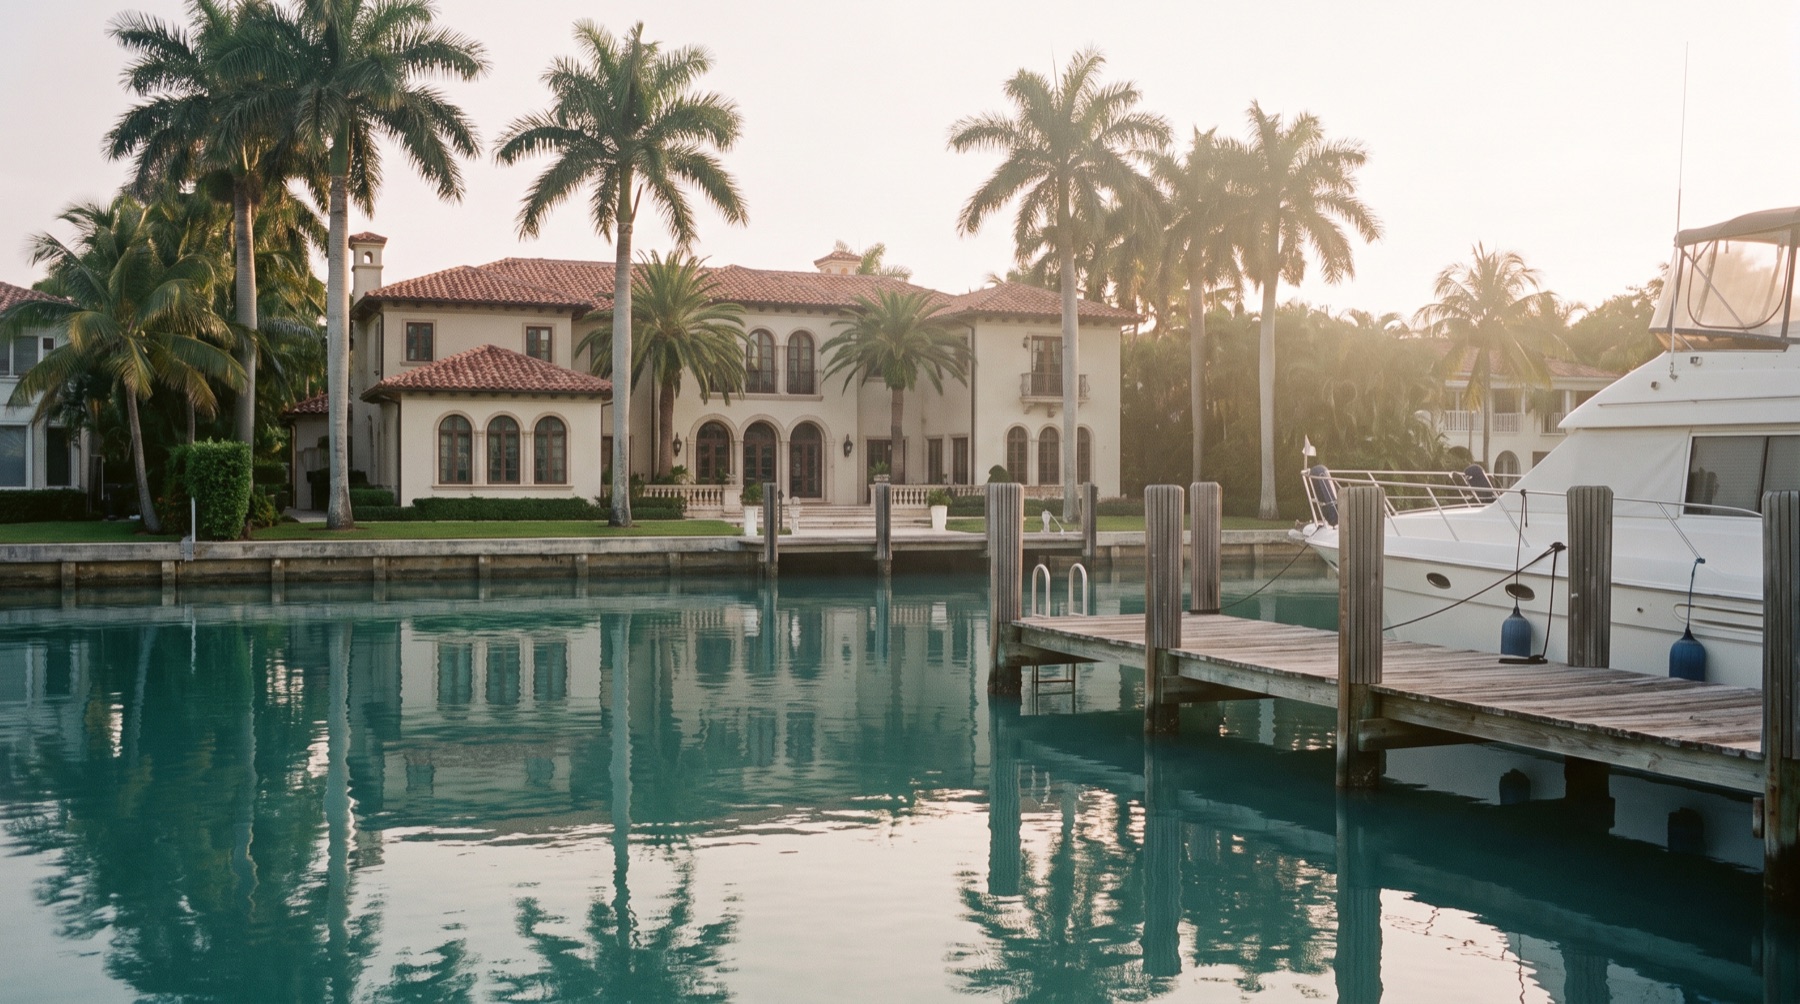
How Julian Acosta reads a Coral Gables house. I start with the side of US-1. North of it, where 1,144 of the 1,557 sales outside the gates since 2022 closed, the median in the last twelve months was $891 a square foot; east of it, $1,020. Then the age of the house: a Merrick-era house closed at a median of $902 a square foot, one of 1961 to 2000 at $843, one built since 2001 at $1,061. Two houses on the same street can be two different products.
Enter your address. The page finds your home in the public record and reads the closed sales nearest it.
An estimate by Julian Acosta from MLS closed sales and the Miami-Dade County record; not an appraisal. How it works →
Would you rather have Julian do it for you? He answers within one business day. Write to Julian →
About this page. The market figures on this Coral Gables homes page are read from MLS closed sales (Compass, first-party) to September 29, 2026 and carry their window where they appear; the tax rate and the exemption come from the Miami-Dade County Property Appraiser, the insurance average from the Florida Office of Insurance Regulation, and the teardown land price is Julian Acosta's first-party read, dated.
This Coral Gables homes page presents market analysis based on MLS closed transactions, Miami-Dade County public records and Julian Acosta's first-party knowledge. This page is not a certified appraisal, legal advice or an investment recommendation; the reader is responsible for any purchase or sale decision. Fair Housing and Equal Housing Opportunity disclosures appear in the footer of Julian Acosta's site.