 1 / 69ACTIVE
$21,900,000
4 beds | 6 baths | 4,435 sqft | 0.65 acres
820 San Pedro Ave, Coral Gables, FL 33156
LISTED BY Compass Florida, LLC↗
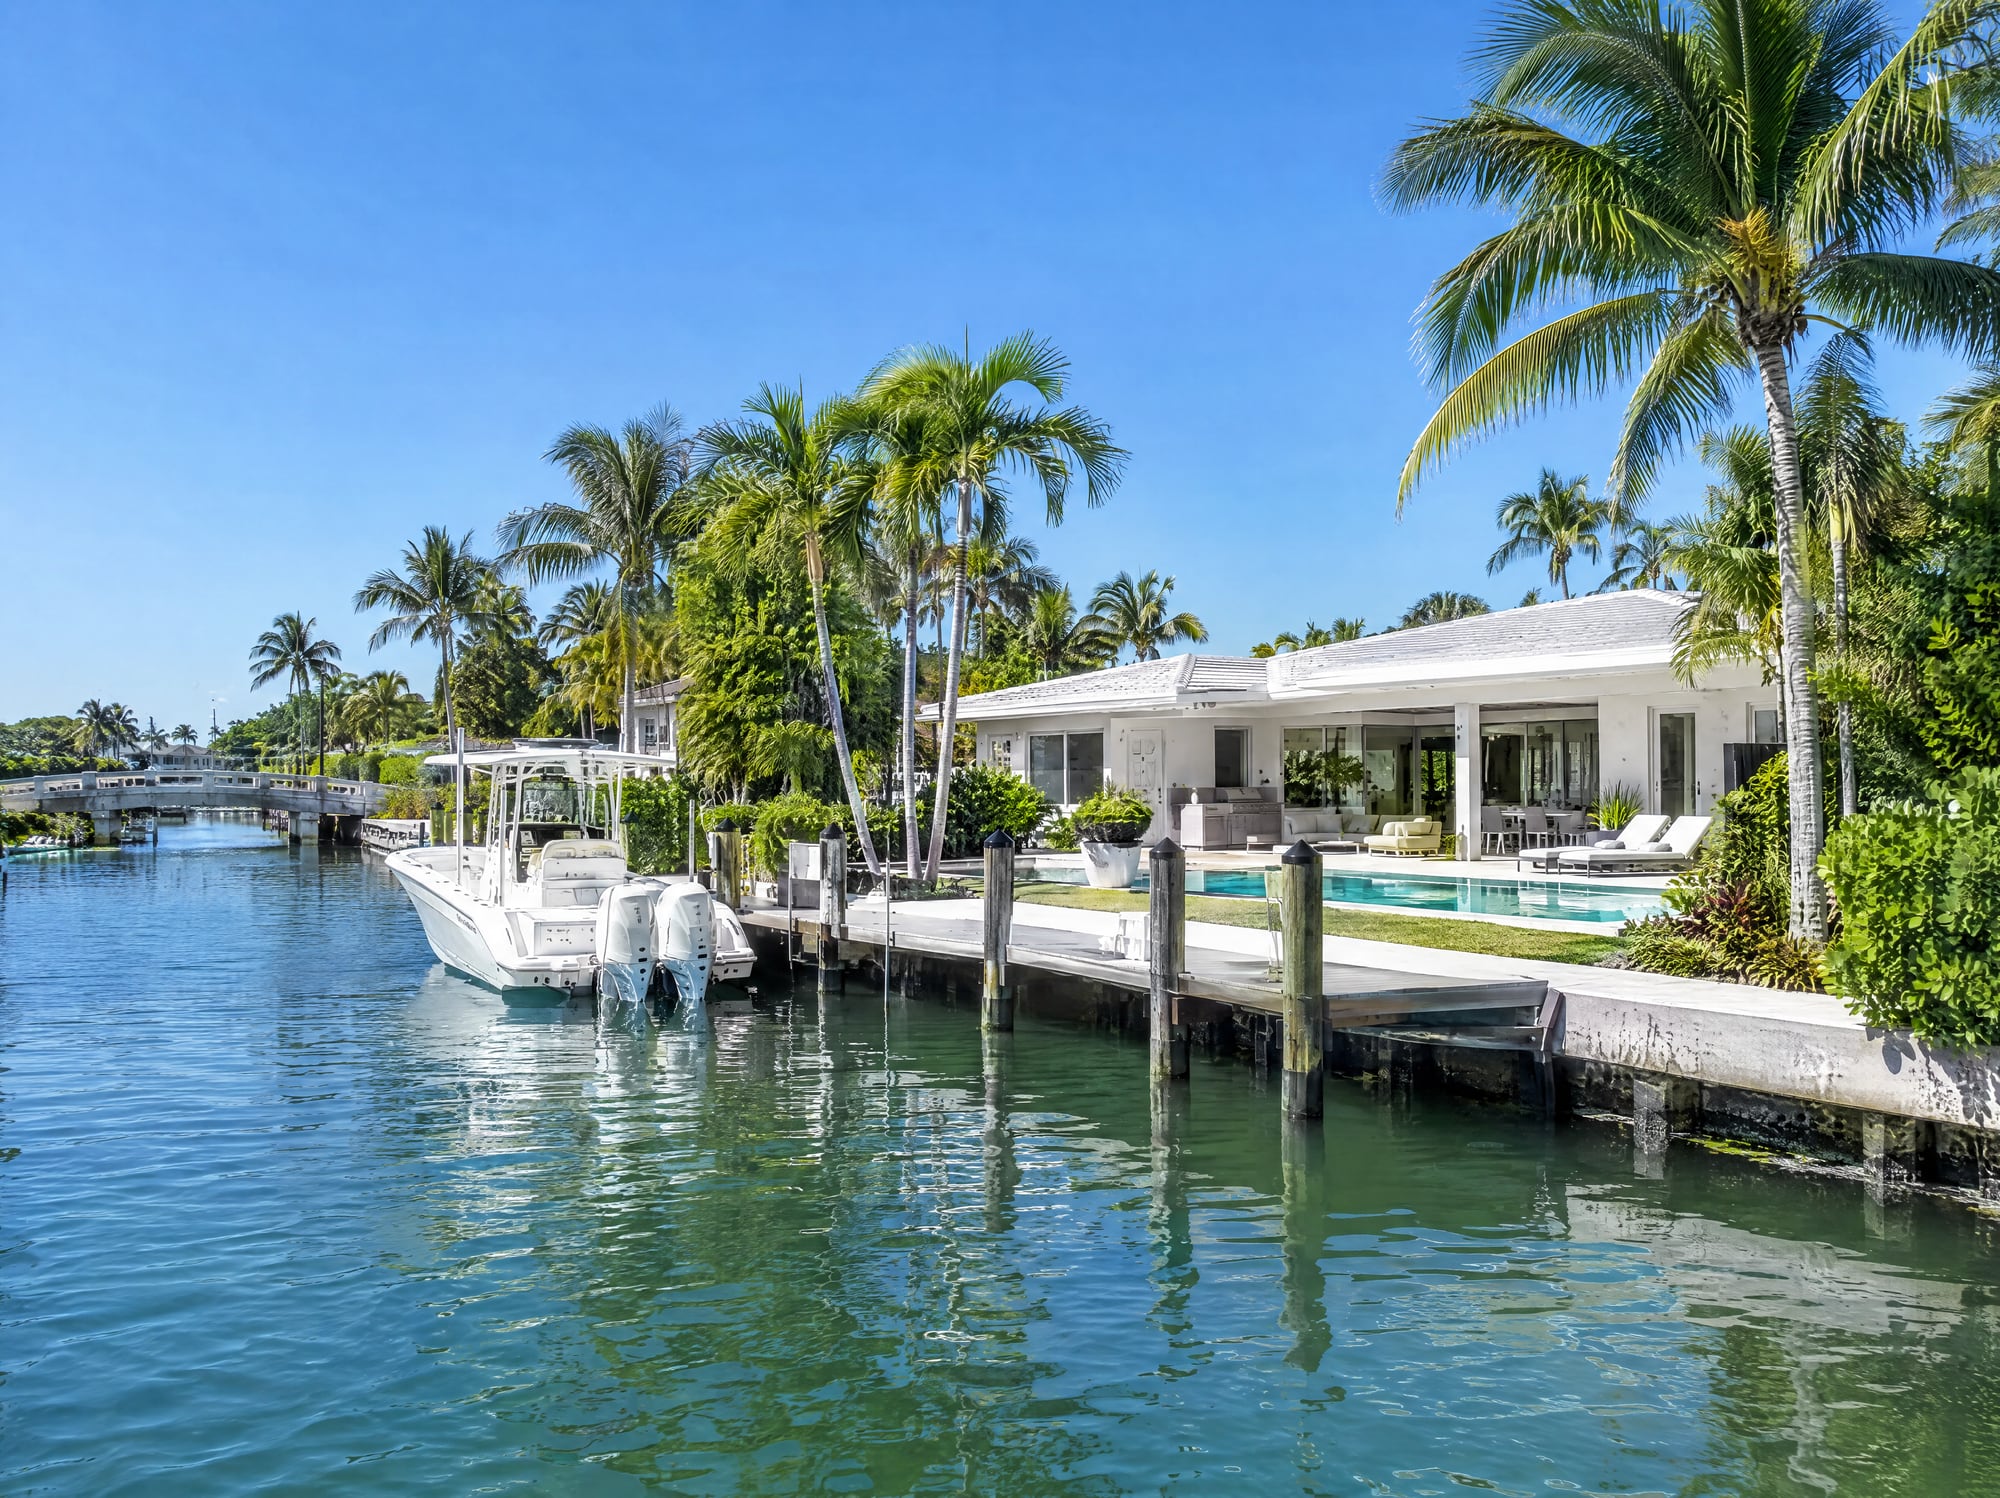
Homes on the Canals, Coral Gables
Gables by the Sea is a gated canal community of Coral Gables beside Biscayne Bay, with 364 single-family homes, 203 of them reaching the bay without passing a bridge, where documented sales from 2022 through 2026 ran from $1.6 million to $6.8 million (MLS; County records), and where Julian Acosta, of Compass, lists and sells homes.
On the market from $2,000,000, in Gables by the Sea, the highest price first.
AS OF OCT 31, 2026 · MLS8 OF 8 FROM $2M SHOWN
1 / 69ACTIVE 1 / 73ACTIVE
 1 / 49ACTIVE
 1 / 39ACTIVE
 1 / 82ACTIVE
 1 / 50ACTIVE
 1 / 50ACTIVE
 1 / 20ACTIVE
By Julian Acosta →, Realtor, Compass · Data read October 19 and 20, 2026
Miami-Dade County Property Appraiser and County water layer, 2026 roll, read October 19, 2026; sales documented from MLS closed sales and County records, 2022–2026.
From 2022 through 2026, 24 homes in Gables by the Sea's Coral Gables district sold at documented prices of $1.6 million to $6.8 million, and the ten sales of 2025 and 2026 closed at a median of $1,312 per square foot (MLS closed sales and Miami-Dade County records). The top of that range is 1051 San Pedro Avenue, which closed at $6.8 million in March 2026.
Gables by the Sea's home lots have a median of 12,000 square feet, and 203 of its 364 homes reach Biscayne Bay without passing a bridge (Miami-Dade County Property Appraiser and County water layer, 2026 roll).
| Community | Documented sales | Price range |
|---|---|---|
| Gables by the Sea | 24 sales, 2022–2026 | $1.6M – $6.8M |
These figures place a Gables by the Sea home against its own district's 24 documented sales, 2022–2026. They are not the value of one home: that is read from its lot, its canal and its house.
Gables by the Sea is a canal community beside Biscayne Bay, run as a County security district. Most of its homes reach the bay without passing a bridge, and some pass one, at Lugo Avenue. Two houses on the same canal can sit on either side of it. When you buy or sell here, I read the route from the dock to the bay first, then the lot, and I show you the sales that share them.
Gables by the Sea lies beside Biscayne Bay around Lugo Avenue; its Coral Gables side is County security district G-261, and its Pinecrest side is a separate district, G-262. Of three Coral Gables gated communities built on canals, Gables by the Sea has the most homes that reach the bay with no bridge: 203, against 81 in Sunrise Harbour and 49 in Cocoplum (Miami-Dade County records, read October 19, 2026).
The public schools that serve Coral Gables homes →
| Community | Homes | Homes on the water | Reach the bay with no bridge | Pass one fixed bridge | On water with no connection to the bay | Home lots | How it is run | District assessment per improved parcel, FY 2026-27 | Documented sales and range | Recent median $/SF (window, sales) |
|---|---|---|---|---|---|---|---|---|---|---|
| Gables by the Sea | 364 | 329 | 203 | 59 (Lugo Avenue, 9.5 ft) | 67 | 9,966 – 35,750 SF | County security district G-261, administered by the City | $1,450 | 24 · $1.6M – $6.8M (2022–26) | $1,312 (2025–26, 10) |
| Cocoplum | 413 | 183 | 49 | 134 (Isla Dorada Boulevard, 21 ft) | 0 | 12,371 – 70,727 SF | Phase I: County security district G-229; Phase II: its associations | $3,865 on Phase I, plus $500 for street lighting | 55 · $3.4M – $17.4M (2022–26) | $1,476 (2025–26, 12) |
| Sunrise Harbour | 89 | 81 | 81 | 0 | 0 | 12,000 – 60,808 SF | County security district G-231, administered by the City | $3,900 | 5 · $5.75M – $16.35M (2022–26) | — |
The three communities are set side by side on the County's record and their documented sales, so a buyer can tell them apart. A median $/SF from ten or twelve sales describes those sales, not the community.
Five of the 24 documented Gables by the Sea sales from 2022 to 2026 are documented by address, at $1.6 million to $6.8 million (MLS closed sales and Miami-Dade County records).
These are the market's sales, not Julian Acosta's own.
| Address | Closed | Price | $/SF |
|---|---|---|---|
| 1051 San Pedro Avenue | March 2026 | $6.8M | $1,424 |
| 13000 San Mateo Street | May 2022 | $6.8M | $1,680 |
| 1220 Lugo Avenue | September 2024 | $6.2M | $2,951 |
| 13050 Miranda Street | November 2024 | $5.5M | $1,193 |
| 1422 Coruna Avenue | December 2025 | $1.6M | $848 |
The sales show where Gables by the Sea homes have closed, sale by sale, because 24 sales in five years are too few for a median a year. A sale's price is its own house and lot, not the community's.
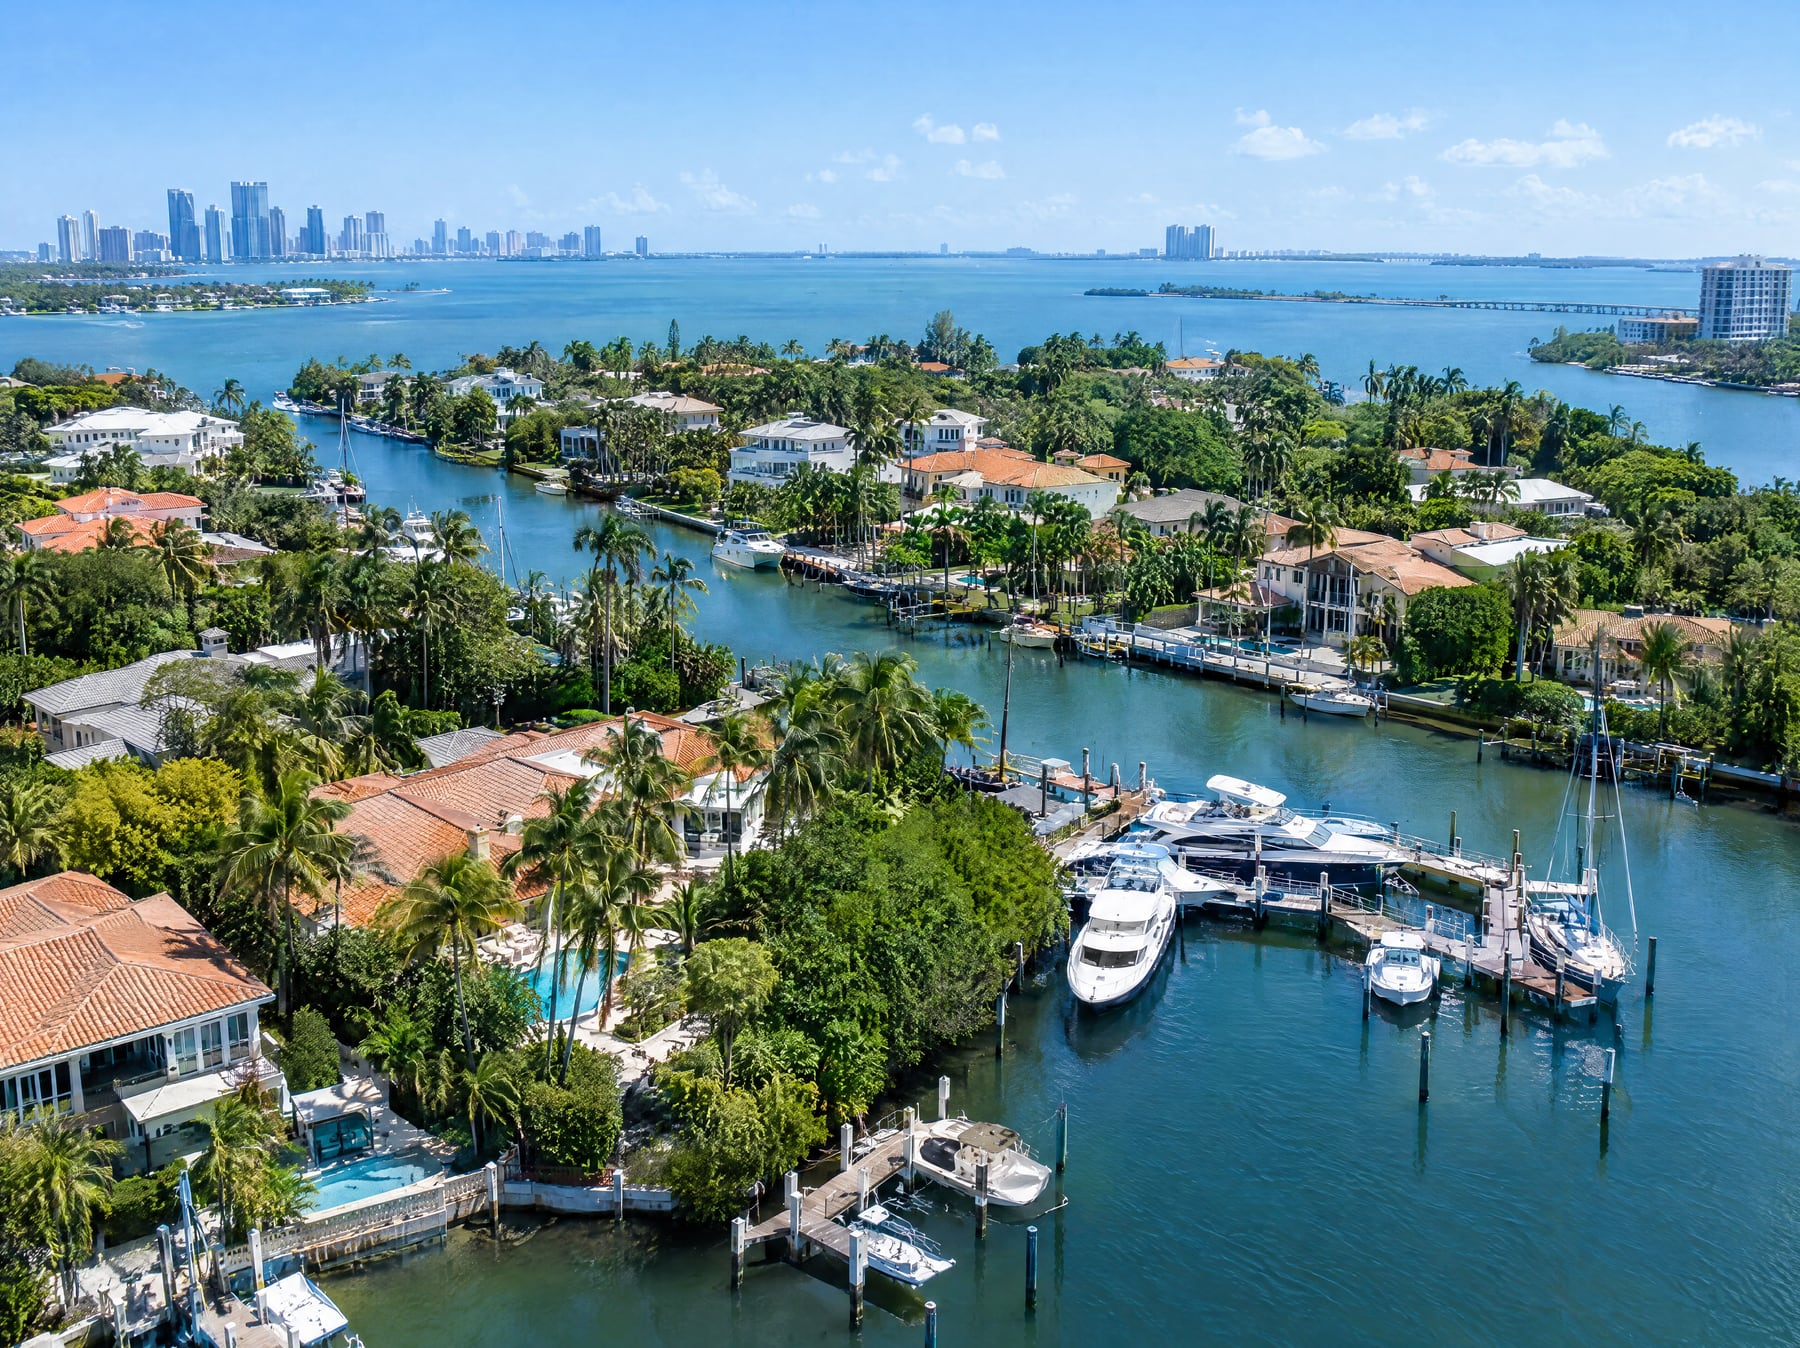
Of the 364 homes in Gables by the Sea's Coral Gables district, 329 touch the water: 6 on open Biscayne Bay, 197 on the canals south of Lugo Avenue, 59 on the canal north of Lugo Avenue and 67 on the western canals; 35 have no water of their own (Miami-Dade County Property Appraiser and County water layer, read October 19, 2026).
The 6 bay homes and the 197 canal homes south of Lugo Avenue, 203 in all, reach Biscayne Bay without passing a bridge (two methods: the County's water layer and the bridge records). North of Lugo Avenue, the 59 canal homes reach the bay under one fixed bridge, Lugo Avenue over Coral Bay, 9.5 feet of clearance by the City's record. The western canals of Agua and Tagus Avenues, with 67 homes, have no water connection to the bay on the County's water layer. NOAA's chart shows water under 1.8 metres (6 feet) on every route, and each route crosses 0.7 to 2.6 kilometres of it. 129 of the 329 Gables by the Sea water homes have a dock on the Property Appraiser's record.
Every Coral Gables home by its water →
| Water | Homes |
|---|---|
| Open Biscayne Bay | 6 |
| The canals south of Lugo Avenue, no bridge | 197 |
| The canal north of Lugo Avenue, one bridge | 59 |
| The western canals, no connection to the bay | 67 |
| No water of their own | 35 |
Of the 364 Gables by the Sea homes, 361 stand mostly inside FEMA's Special Flood Hazard Area: 339 in zone AE, with a base flood elevation of 11 to 13 feet, and 22 in zone VE, the coastal high-hazard zone, at 13 to 17 feet. The other 3 stand mostly in zone X. 27 lots touch zone VE (FEMA's effective flood map, in Miami-Dade County's flood-zone layer, read October 20, 2026). In zones AE and VE, a mortgage from a federally regulated lender requires flood insurance, and a new or substantially improved house must be built to the zone's elevation (FEMA). A lot's own ground and floor elevations are on its survey and its elevation certificate.
These counts say which of the 364 homes have water and how it reaches the bay, from the County's record. They do not state today's depth at a dock, which only a survey reads.
Gables by the Sea homes stand on lots of 9,966 to 35,750 square feet, with a median of 12,000 and the middle half between 11,698 and 13,117 (Miami-Dade County Property Appraiser, 2026 roll, read October 19, 2026). The Coral Gables district covers 216.4 acres and holds 7 vacant lots besides its homes.
A median lot is the middle one when the 364 are set in order; the middle half runs from the 25th to the 75th percentile.
| Read | Figure | Note |
|---|---|---|
| Median home lot | 12,000 SF | 2026 roll |
| The middle half | 11,698 – 13,117 SF | 2026 roll |
| Smallest · largest | 9,966 · 35,750 SF | 2026 roll |
| The district | 216.4 acres | 2026 roll |
The 364 lots show how much land a Gables by the Sea home stands on, from the County's roll. A lot's size is not its value.
The median Gables by the Sea house was built in 1973, the middle of the 364; 26 were built in 2010 or later, 15 of them since 2020, and the oldest dates from 1957 (Miami-Dade County Property Appraiser, year built, 2026 roll, read October 20, 2026).
The year is the County's year built for the main house; a renovation does not change it.
| Built | Houses |
|---|---|
| Before 1960 | 9 |
| 1960 – 1979 | 222 |
| 1980 – 1999 | 72 |
| 2000 – 2009 | 35 |
| 2010 – 2019 | 11 |
| 2020 and later | 15 |
The years of the 364 houses show how much of Gables by the Sea is recent construction and how much is houses of the 1960s and 1970s, from the County's roll. A house's year is not its condition.
Gables by the Sea's Coral Gables side is governed by security district G-261, created by Miami-Dade County in 2022 for the Coral Gables side and administered by the City of Coral Gables (Miami-Dade County security district layer, Ordinance 22-122; City of Coral Gables special taxing district portal, read October 19, 2026). The Pinecrest side has its own district, G-262, created by the same ordinance; before 2022 one County district, G-223 of 1995, spanned both towns. G-261's record lists one gate. The County's two guardhouse records for Gables by the Sea, at 5765 SW 128 Street and 5979 SW 134 Street, both stand in Pinecrest by the County's municipal layer, the first at the Lugo Avenue entrance.
If you are buying, the district's assessment comes with the house: it is billed on every improved parcel in the district (section 08).
A home in Gables by the Sea's Coral Gables district is taxed at the Coral Gables rate, 18.1852 mills in 2025 in total, and its bill carries the district's assessment, $1,450 per improved parcel for fiscal year 2026-27, adopted by the City on September 14, 2026 (Miami-Dade County Property Appraiser, 2025 adopted millage rates; City of Coral Gables Resolution 2026-253).
An estimate at the adopted millage, before the City's charges on the same bill (solid waste and fire protection) and before the Save Our Homes cap. A home's own tax comes from its assessed value and its exemptions.
Tax a year · 2025 adopted millage
$18,185
$1,515 a month
| Owner | Taxable value · school levies | Taxable value · other levies | Tax a year |
|---|---|---|---|
| Without homestead | $1,000,000 | $1,000,000 | $18,185 |
| With homestead | $975,000 | $949,278 | $17,433 |
The total levy on a Coral Gables parcel was 18.1852 mills for tax year 2025, as adopted: 5.5590 for the City, 6.6330 for the School Board, 4.5740 for Miami-Dade County's operating budget, and the rest for county debt, the library district, The Children's Trust and the regional water and navigation districts. A mill is one dollar per $1,000 of taxable value. Coral Gables runs its own fire department, so its parcels pay no Miami-Dade Fire Rescue District levy.
The purchase resets the assessment. A home is assessed at its just value as of January 1 of the year after the sale — the value the Property Appraiser sets, not necessarily the price paid. The tax a listing shows is the seller's, often held down by years of capped increases; it is not the buyer's next bill.
A primary residence qualifies by filing with the Property Appraiser by March 1: $25,000 off the assessed value for every levy, and a second exemption on the value between $50,000 and $75,000 for levies other than the School Board's — $26,411 in 2026, indexed to inflation each year. In the first year the difference is small. What the exemption buys is the cap that follows it.
Once a home is homesteaded, the yearly rise in its assessed value is limited to 3% or the change in the consumer price index, whichever is lower: 2.7% for 2026, 2.9% for 2025. A property without homestead has its own cap, 10% a year, which does not apply to school levies. An owner who moves from one Florida homestead to another within 3 years can carry up to $500,000 of the accumulated difference to the new home.
Amendment 3, placed on the ballot by the Legislature, would raise the homestead exemption from non-school taxes to $150,000 in 2027 and $250,000 in 2028, indexed after that; keep the school exemption at $25,000; and lower the yearly cap on non-homestead properties from 10% to 5%. It needs 60% of the votes cast to pass. This note is rewritten with the result after the election.
Two City charges are billed per dwelling unit with the property tax for fiscal 2026-27: $601 for solid waste collection ($572 if paid directly to the City by August 15), and a $70 fire protection assessment.
11 security districts, one of them with a street-lighting district on the same parcels, are administered by the City of Coral Gables, which took them over from the County on October 1, 2018. Each is a line on its parcels' tax bill; the rates above were adopted on September 14, 2026, and a vacant lot pays half. Six of the fourteen gated communities are not special taxing districts: Gables Estates, Cocoplum's second section, Tahiti Beach, Deering Bay, Journey's End and Cutler Oaks Estates appear neither in the City's assessment resolutions nor in the County's district map, so their bills carry no district line. Two of the districts overlap on Banyan Drive: the homes of Banyan Lakes pay the Banyan Drive district, and all of them but those on Palm Vista and Banyan Trail also pay the Hammock Lake Banyan district's roving patrol, which every home in Hammock Lakes pays on top of its own district. In Gables Estates, the Gables Estates Club's membership requirement is $100K, according to Julian Acosta.
Outside the gates, almost never: of the 317 single-family homes outside the gated communities sold in the twelve months to September 29, 2026, 4 reported an association; inside the gates, 52 of 72 did. Condominiums are the opposite. Their median association fee was $1,136 a month across 224 sales in the same twelve months, with the middle half between $779 and $1,453.
Miami-Dade and Broward form the Florida Building Code's High-Velocity Hurricane Zone. The state insurance regulator's county averages, on data as of March 31, 2026, are $5,975 a year for a homeowners policy that includes wind and $2,801 for a condominium unit-owner policy that includes wind, in Miami-Dade; the premium actually charged varies with the insurer, the insured value and the deductible. Insurers must offer hurricane deductibles of $500 and 2%, 5%, 10% of the dwelling limit; for dwellings insured between $1M and $3M they may offer 3% instead of 2%, and above $3M they need not offer 2%. A wind-mitigation inspection on the state's form is valid for up to 5 years and is the basis of the mitigation discounts insurers are required to file.
The FEMA flood map in effect is the one of September 11, 2009; the preliminary maps published in 2021 are not in effect. It places zones AE, VE and AH — the Special Flood Hazard Area — inside the city, concentrated along the bay and the canals of the south, while most of the land in the northern part of the city maps as Zone X. Since October 1, 2025, a seller must state before the contract whether the property has flooded during their ownership and whether they have filed a flood claim or received federal flood assistance. The City issues flood-zone determinations and publishes the elevation certificates it holds.
A mortgage backed by the federal government on a building in the Special Flood Hazard Area requires flood insurance. Citizens Property Insurance requires flood coverage as a condition of its policies: in the flood zone since 2023, outside it for dwellings with a replacement cost of $400,000 or more since January 1, 2026, and for every policy from January 1, 2027; condominium unit-owner policies are exempt. Coral Gables takes part in FEMA's Community Rating System at Class 5, which discounts every National Flood Insurance Program policy in the city by 25%, inside the flood zone and outside it.
In Coral Gables, improvements whose combined cost over 5 years reaches 50% of the building's market value count as a substantial improvement, and the building must then meet the flood rules for new construction — among them, a lowest floor at least 1 foot above the base flood elevation. For an older house in the flood zone, that threshold shapes the renovation budget before the purchase.
No public source measures what a Coral Gables house costs to maintain, and this guide prints no figure it cannot source. Three facts decide most of it. The age of the house: outside the gates and north of US-1, the homes sold in the last twelve months have a median year built of 1952; in the lettered sections it is 1938. The review: every exterior alteration goes before the Board of Architects, and a property on the Coral Gables Register of Historic Places needs a certificate of appropriateness. The flood threshold: in the flood zone, work that reaches 50% of the building's value over 5 years brings the rules for new construction with it. In a condominium, the building's upkeep is in the association fee and in its reserves. For a specific house, the number comes from its inspection, before the offer is firm.
Tax, insurance and assessments depend on the home: its assessed value, its flood zone, its district. Ask for the figures of the one you are considering.
The millage and the assessment, $1,450 for fiscal year 2026-27, say how the tax on a Gables by the Sea home is built. The bill on one home follows its taxable value, which the Property Appraiser sets.
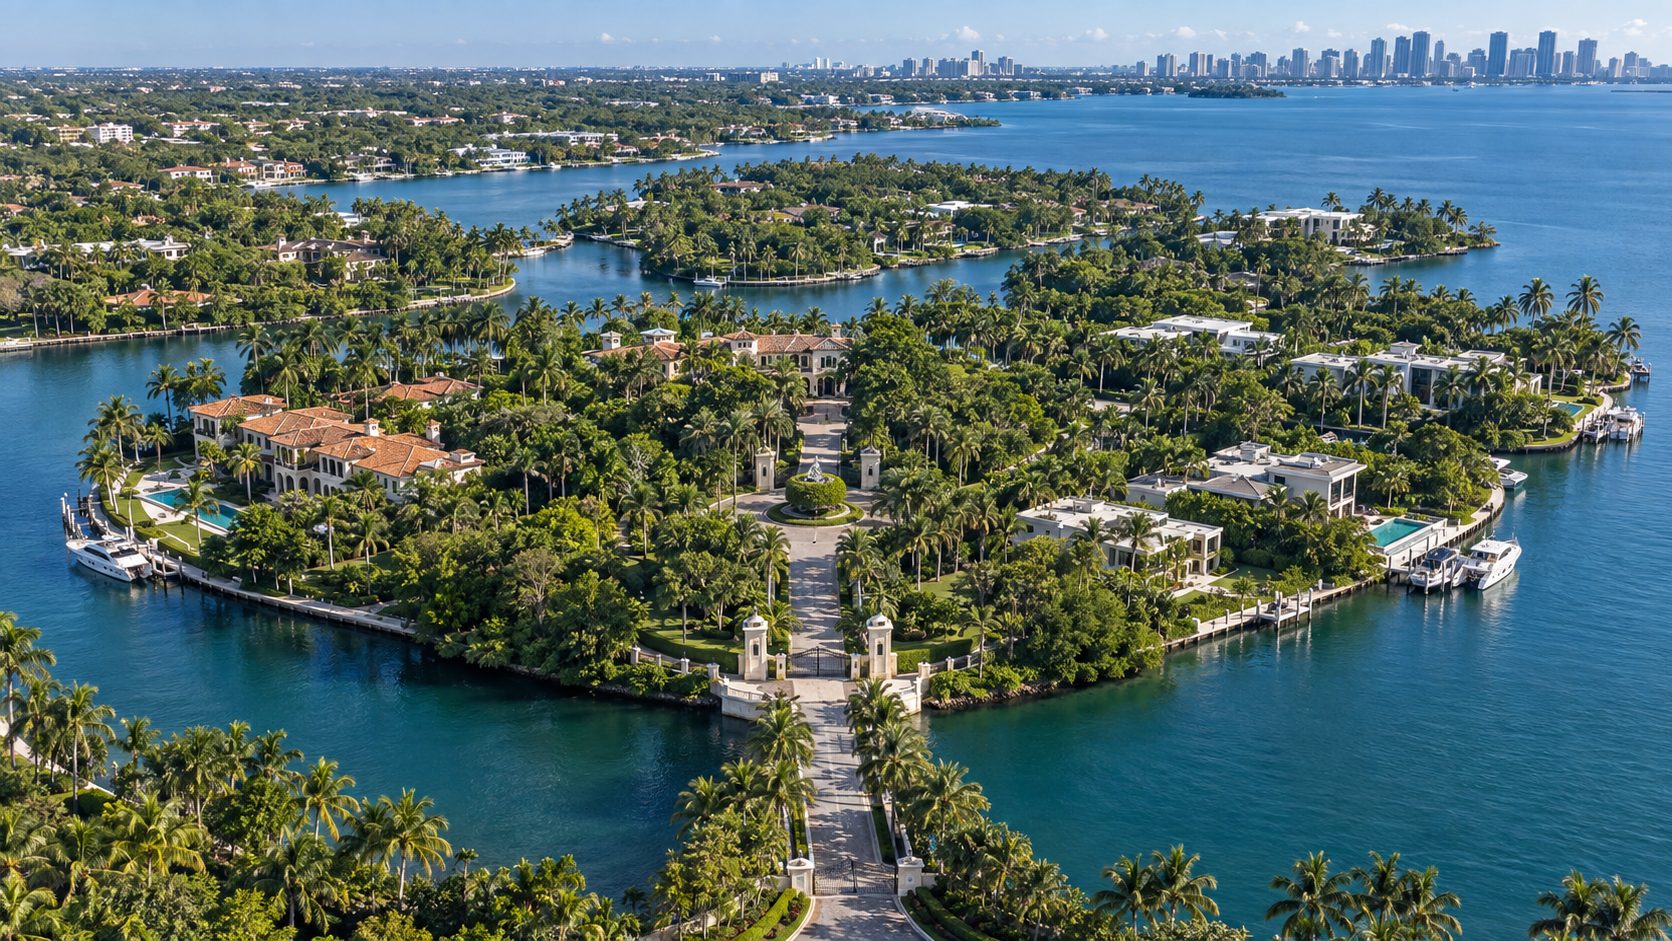
In Gables by the Sea, which canal a house sits on decides its way to the bay. Tell me what you want on the water, and I will tell you which homes reach it.
Enter your address. The page finds your home in the public record and reads the closed sales nearest it.
An estimate by Julian Acosta from MLS closed sales and the Miami-Dade County record; not an appraisal. How it works →
Would you rather have Julian do it for you? He answers within one business day. Write to Julian →
About this page. The figures on this Gables by the Sea page are read from the Miami-Dade County Property Appraiser's 2026 roll and the County's water, guardhouse and security district layers, read October 19, 2026; FEMA's effective flood zones in the County's layer and the roll's years built, read October 20, 2026; the City of Coral Gables' bridge record and special taxing district portal; NOAA's nautical chart; the Property Appraiser's 2025 adopted millage rates; the City of Coral Gables' district assessments of fiscal year 2026-27; and the documented sales of 2022 to 2026, MLS closed sales and Miami-Dade County records. It reads the Coral Gables district only; the Pinecrest side is not on this page.
This Gables by the Sea page presents market analysis based on MLS closed transactions, Miami-Dade County public records and Julian Acosta's first-party knowledge. This page is not a certified appraisal, legal advice or an investment recommendation; the reader is responsible for any purchase or sale decision. Fair Housing and Equal Housing Opportunity disclosures appear in the footer of Julian Acosta's site.